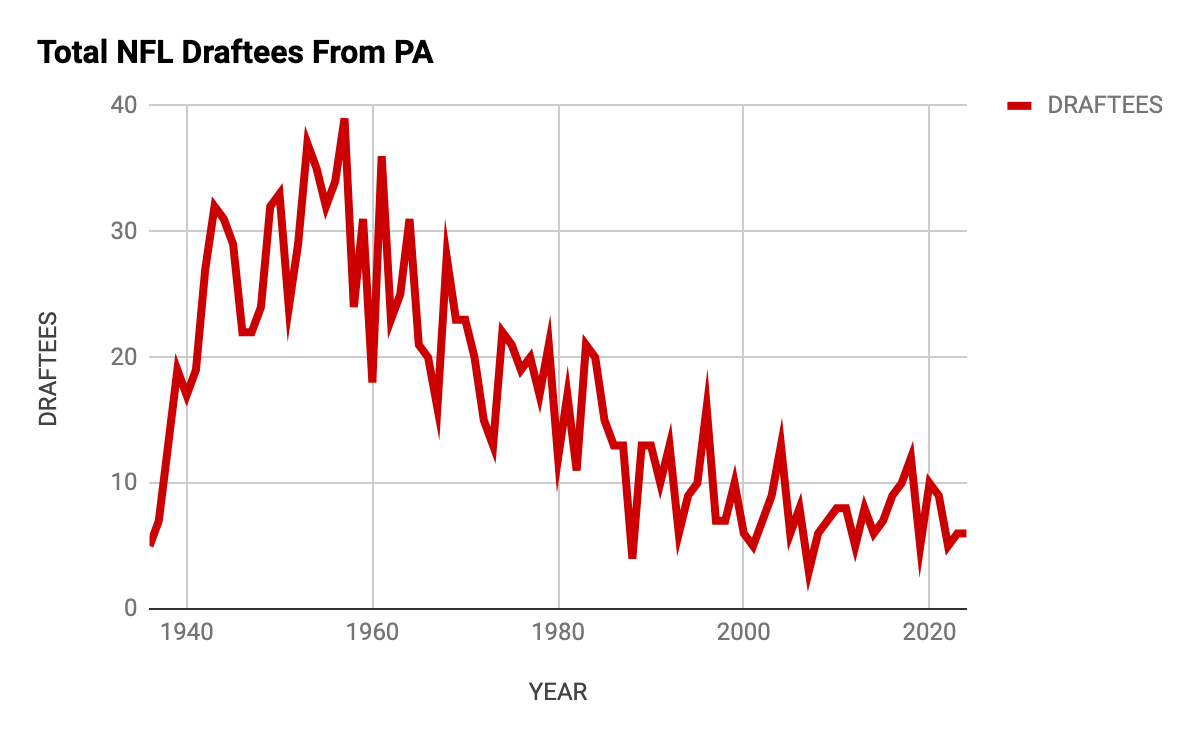
Every NFL Draft – which began in 1936 – has featured at least three players who competed in high school in Pennsylvania. This year’s edition will kickoff Thursday in Pittsburgh. Take a look at the following tidbits and links to explore our state’s history over the previous 90 NFL Drafts.
2025 NFL Draft Recap
Last year’s Draft saw just five players from PA high schools selected, tying 2012, 2019 and 2022 for the fewest picks in a year since the all-time low of three selections in 2007. Here is a breakdown of each 2025 draftee who played in Pennsylvania:
Abdul Carter (LaSalle) – 1st Round, 3rd overall pick to the Giants
- Highest-selected PA high school grad since Saquon Barkley was chosen 2nd overall in 2018, also by the Giants.
- First LaSalle grad to be selected since Jimmy Morrissey (7th round, 230th overall by the Raiders) in 2021.
- Third LaSalle linebacker to be selected all-time, joining Zaire Franklin (2018) and Charlie Zapiec (1972).
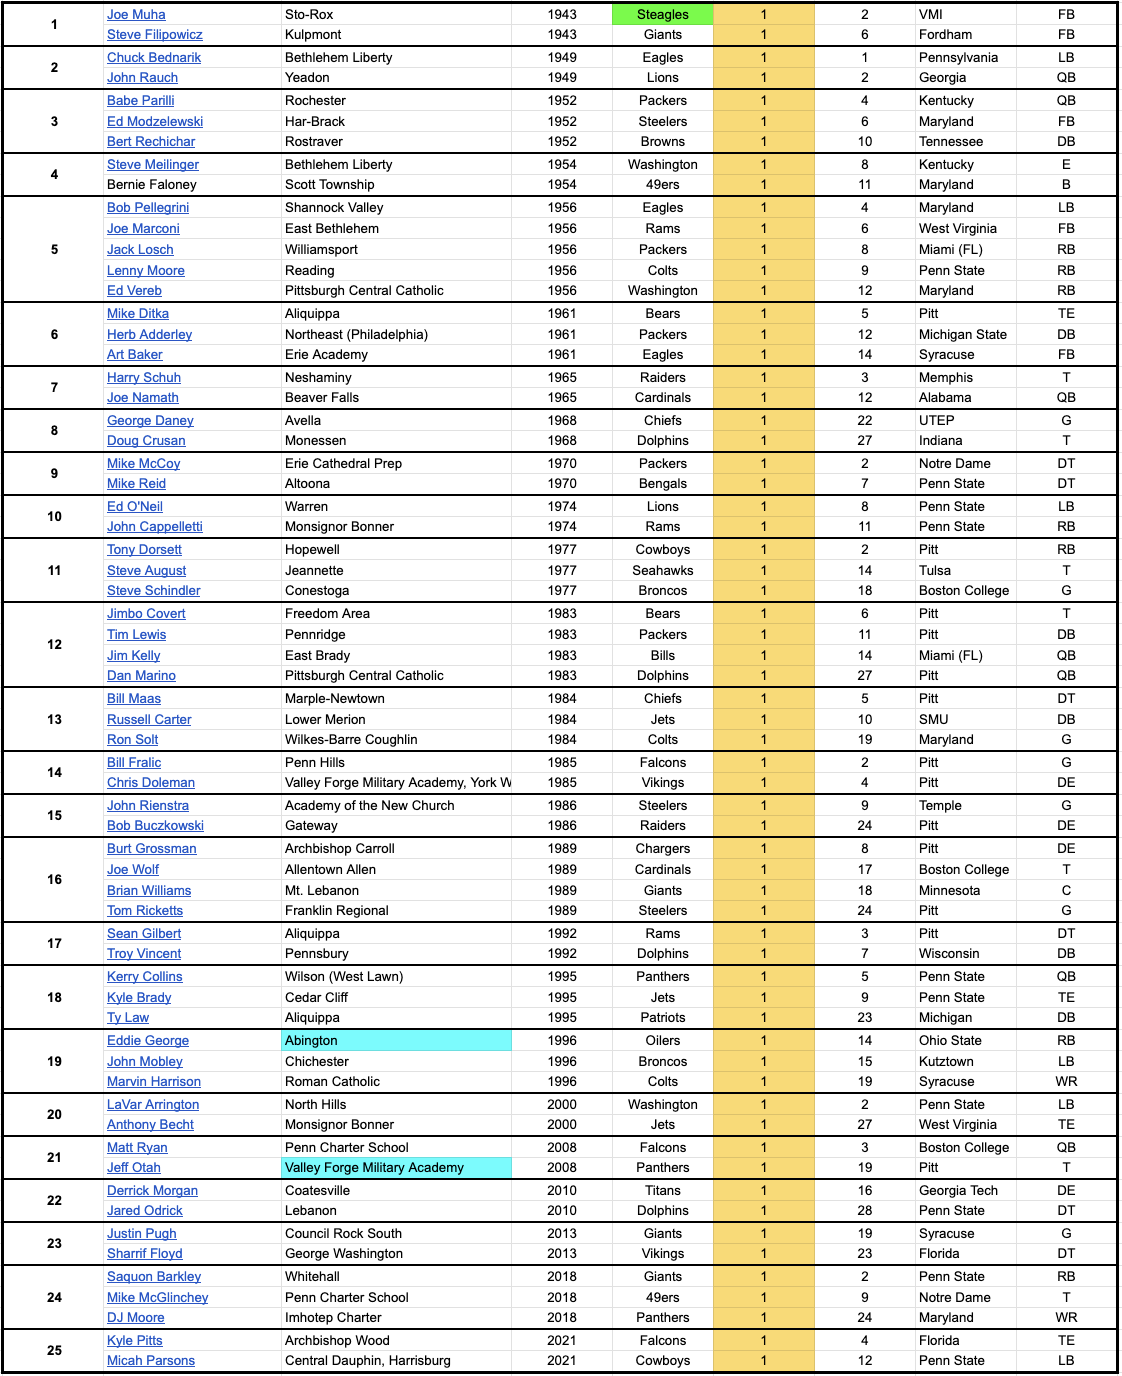
- Is the 97th first-round pick among Pennsylvania high school graduates.
Kyle McCord (St. Joseph’s Prep) – 6th Round, 181st overall pick to the Eagles
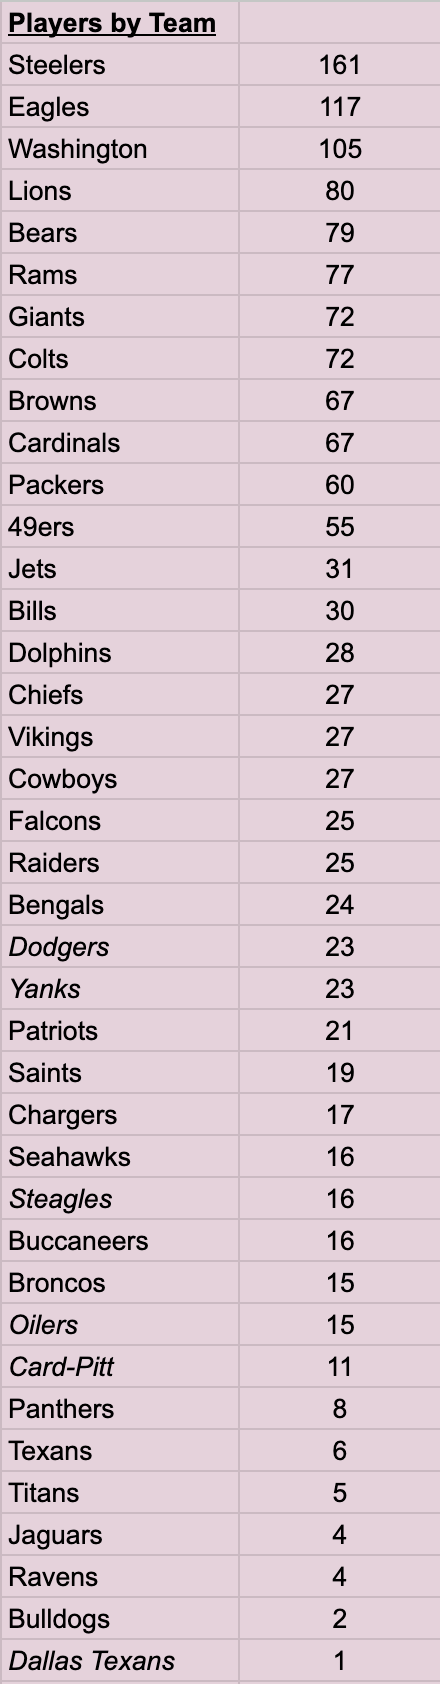
- The 118th PA player to be selected by the Eagles
- St. Joe’s Prep’s 12th NFL Draft pick all-time and second QB, joining Rich Gannon (1987).
- The third player from St. Joe’s to be picked by the Eagles, but the first since Forrest Hall in 1945 (Fran Murray in 1937 was the first).
- The 23rd PA player to be selected out of Syracuse and the first since Franklin.
Will Howard (Downingtown West) – 6th Round, 185th overall pick to the Steelers
- The first player ever selected from Downingtown West. Paul Siever was chosen in the 1992 Draft but played at Downingtown HS before it split into East and West a decade later. Downingtown East has had two selections – Tyler Kroft in 2015 and Kyle Lauletta in 2018.
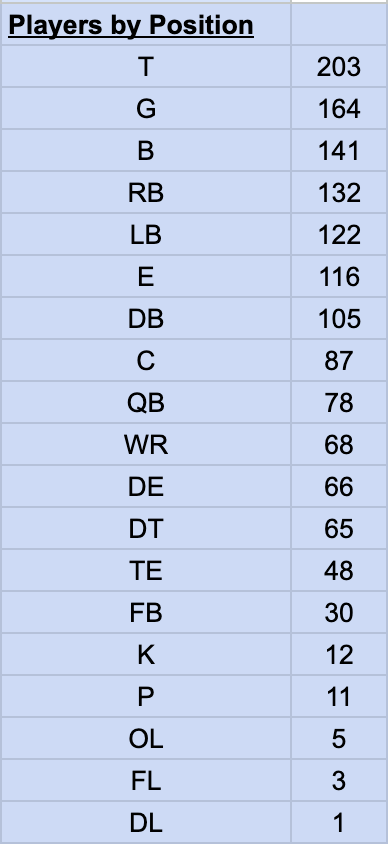
- The 80th PA high school quarterback ever selected (McCord was 79th).
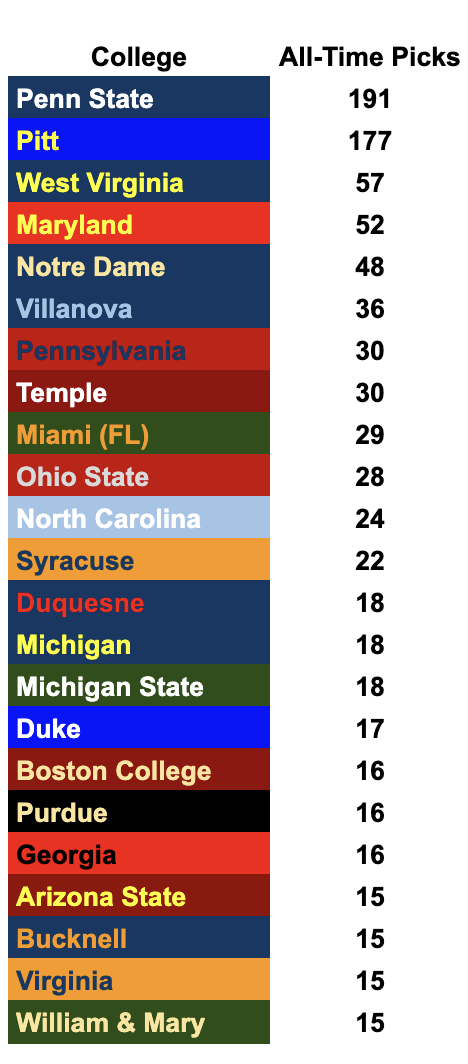
- The 29th Ohio State player from a PA high school to be picked, tying the Buckeyes with Miami (FL) for the ninth-most among college programs.
Gavin Bartholomew (Blue Mountain) – 6th Round, 202nd overall pick to the Vikings
- The first player ever selected from Blue Mountain. Bartholomew is the first player chosen from a Schuylkill County school since Marian Catholic’s Sean Love was chosen by the Cowboys in 1991.
- The first District 11 player chosen since Nazareth’s Jahan Dotson in 2022.
- The 49th tight end and the 178th Pitt Panther from PA chosen.
Donte Kent (Harrisburg) – 7th Round, 229th overall pick to the Steelers
- The first player from Harrisburg selected since Micah Parsons in 2021 and the 7th Cougar selected all-time.
- The first PA player to ever be selected out of Central Michigan.
- Joins Joey Porter, Jr. (2023), Daequan Hardy & MJ Devonshire (2024) to give PA a cornerback selected in three consecutive Drafts.
PA High Schools with 10+ NFL Draft Selections
In all, 503 different high schools in Pennsylvania have had at least one player selected in an NFL Draft. Here are the 18 with at least ten draftees:
| HIGH SCHOOL | PLAYERS DRAFTED |
| McKeesport | 22 |
| Pittsburgh Central Catholic | 21 |
| Johnstown | 16 |
| Uniontown | 16 |
| Aliquippa | 14 |
| Allentown Allen | 14 |
| Altoona | 14 |
| Clairton | 14 |
| Beaver Falls | 12 |
| Bethlehem Liberty | 12 |
| Mt. Lebanon | 12 |
| Penn Hills | 11 |
| Ambridge | 10 |
| Bishop McDevitt (Harrisburg) | 10 |
| Monessen | 10 |
| North Braddock Scott (now part of Woodland Hills) | 10 |
| St. Joseph’s Prep | 10 |
| Vandergrift (now part of Kiski Area) | 10 |
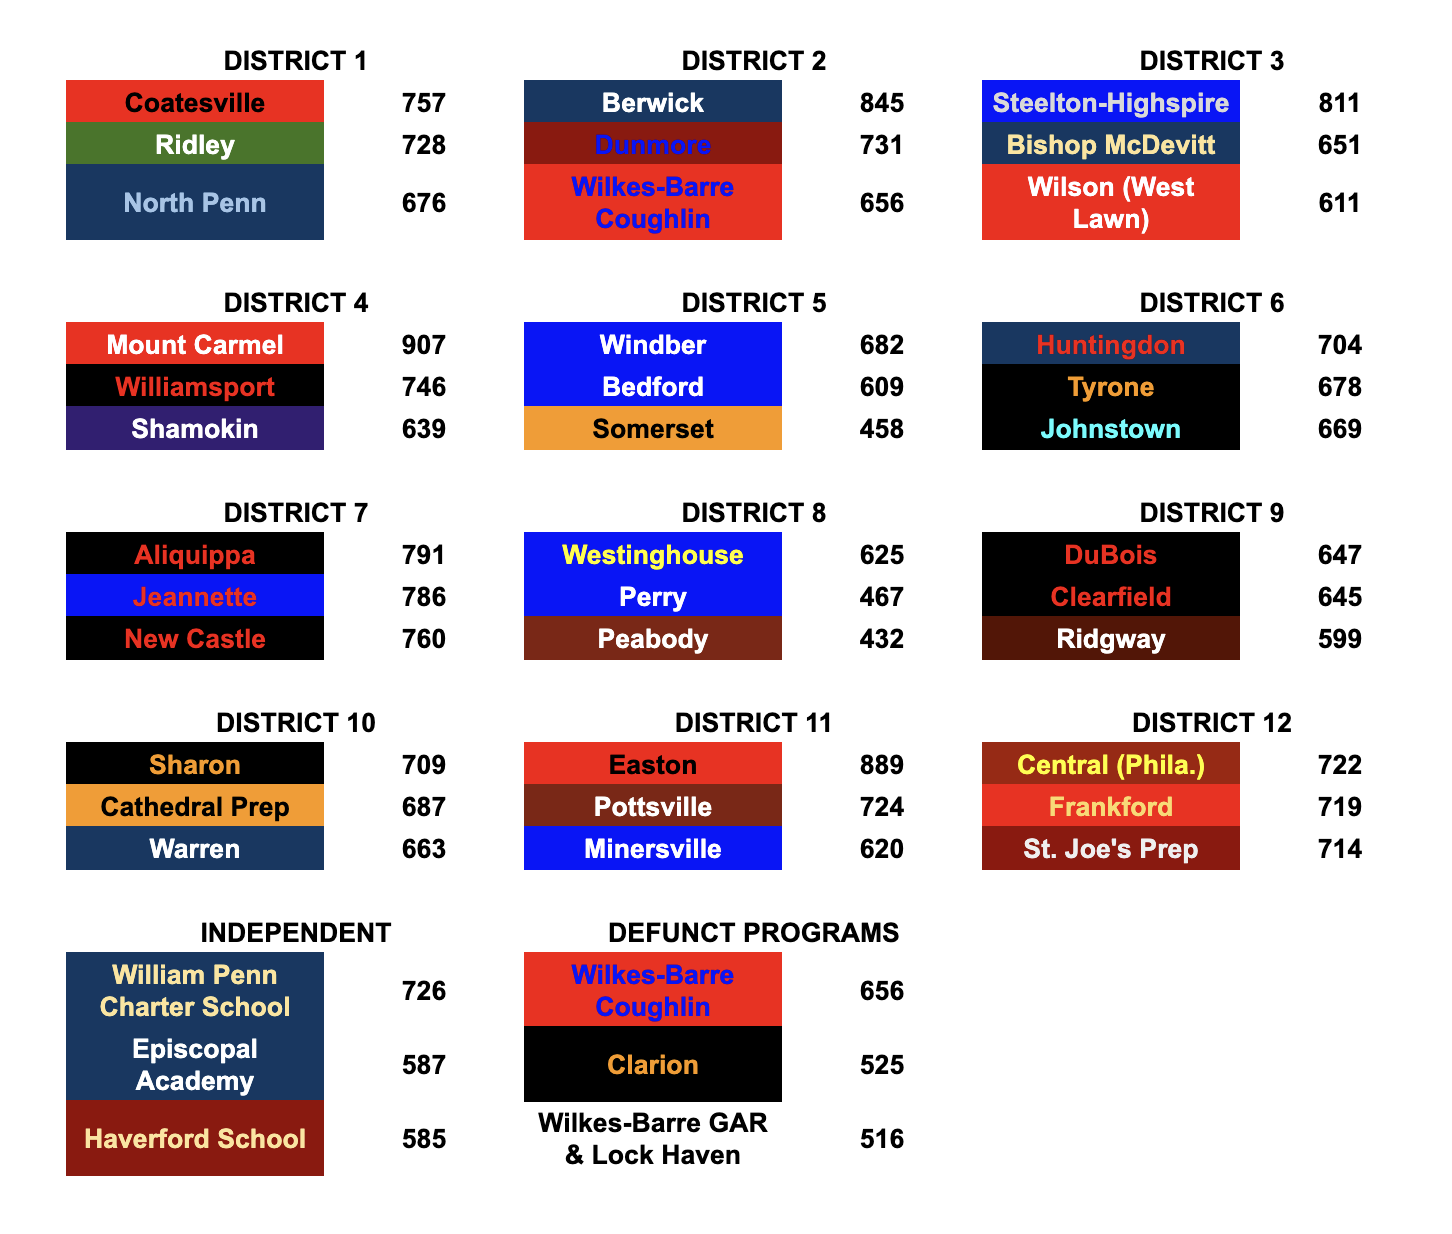
Most Drafted Players by PIAA District
Some schools on this list – like Johnstown and Farrell – have switched PIAA districts over time. This list shows schools with their current district.
| DISTRICT | SCHOOL | SELECTIONS |
| 1 | Neshaminy | 7 |
| 2 | Hanover Area & Hazleton | 9 |
| 3 | Bishop McDevitt | 10 |
| 4 | Williamsport | 8 |
| 5 | Conemaugh Township | 5 |
| 6 | Johnstown | 16 |
| 7 | McKeesport | 22 |
| 8 | Westinghouse | 7 |
| 9 | DuBois | 3 |
| 10 | Erie Tech, Farrell & Sharon | 6 |
| 11 | Allentown Allen | 14 |
| 12 | St. Joseph’s Prep | 10 |
| Independent | Kiski Prep | 8 |
Links
All-Time list of NFL Draft picks
All draft picks, sorted by school (includes NFL, AFL & AAFC draft picks)