
I’m going to warn you right now: this post was born from a combination of boredom and a fairly stupid idea.
We’re in late March, essentially the dark side of the Moon when it comes to the high school football calendar. The 2024 season is falling further and further behind us with each passing day, yet the 2025 season doesn’t feel particularly close yet. One of two things will happen regarding high school football discussion at this point of the calendar: it’ll fall to the back burner or we can throw mud at the wall and conjure up ridiculous scenarios.
So…let’s get weird.
In the spirit of March, I wanted to create a statewide high school football playoff bracket in the mold of the NCAA Men’s Basketball Tournament. This is a true statewide bracket where the PIAA districts and classifications of the real world don’t exist and teams from across the Commonwealth are seeded into one massive bracket. In its current iteration, the NCAA Tournament selects 68 teams (four of whom participate in play-in games). With over 550 teams in Pennsylvania playing high school football, I thought 96 would be a better choice to keep the qualifier-to-total team ratio more in-line with college basketball. Eventually, though, I settled on a 128-team tournament for a couple of reasons. First, 96 teams would require play-in games, which are fine in general but not as clean and orderly as full-round brackets. Secondly, I wanted to live by the maxim of “bigger is better.” There are lots of good teams in the state right now and if we’re going to make an insane hypothetical bracket, then let’s do it right and go all the way with it.
The Selection Process
College basketball and high school football are obviously very different animals. I tried to keep the selection process for this exercise as similar to the NCAA Tournament as possible.
This began with awarding automatic bids. For the basketball tournament, all conference tournament champions gain automatic entry into the NCAA Tournament. For our purposes, all district champions at each of the six classifications gained an automatic bid to keep in line with this as much as possible. Not all districts have teams in all six classes, but this procedure filled 63 of the 128 slots in the bracket. Because of the odd nature of the PIAA playoff system and the use of subregional tournaments in some areas and classifications, a few teams earned auto bids that didn’t formally win a PIAA district title. For example, 5A has a subregional comprising Districts 6, 8, 9 and 10, which was won by D6’s Hollidaysburg. However, the District 8, 9 and 10 representatives (Allderdice, DuBois and Cathedral Prep) were also given auto bids into the hypothetical state tournament as the last remaining (or even sole) 5A representative from their district, even though they didn’t officially win that district championship on the field. This only impacted a small number of teams overall, so despite it not being a clean solution, it didn’t make much of a difference in the grand scheme of things.
Once all of the automatic qualifiers were entered, the remaining 65 slots were issued to “at-large” teams, just as it is done in the NCAA Tournament. Because I’m just some guy with a (dumb?) idea working alone, there was no Selection Committee to decide on the at-large selections. Instead, I used the HSRatings.com (formerly CalPreps.com) computer ratings to fill in the remaining teams. These ratings combine margin of victory with strength of schedule, which typically leads to common-sense results. But sometimes it doesn’t! This method tends to favor larger schools over smaller schools because it considers their schedule strength to be more difficult in general. However, it can also push smaller schools who win by large margins higher, even if their schedule strength wasn’t outstanding. You can choose to agree or disagree with that, but it made sense for me to use one standard metric for this. I’m not going to argue methodological points on a hypothetical “just for fun” thing in the offseason.
The teams earning at-large berths were:
- The first 65 teams with the highest rating that did not win an automatic bid
- PIAA schools (no non-PIAA teams were included)
- Teams with at least a .500 record
Similar to the NCAA Tournament, a number of automatic bid teams are rated lower – sometimes much lower – than the teams that receive the final at-large berths. In the true spirit of this exercise, here are the Last Four In and First Four Out:
Last Four In:
Abraham Lincoln (7-5)
Clairton (13-1)
Springfield (Montco) (9-3)
Cocalico (8-4)
First Four Out:
Archbishop Ryan (7-4)
West Mifflin (5-5)
Neshaminy (6-5)
Ridley (7-5)
Once all 128 slots were filled, teams were ranked by their HSRatings.com computer ratings to create a fully seeded list, from 1 to 128. Then, in the same method the NCAA Selection Committee uses, those 128 teams were assigned regions and seeds using an “S-Curve” process. The four 1-seeds were St. Joseph’s Prep, LaSalle, Pittsburgh Central Catholic and Monsignor Bonner. The S-Curve then paired the strongest 2-seed (Pine-Richland) with the lowest-rated 1-seed (Bonner), and continued snaking its way through the entire field. After that, four separate 32-team brackets were built. I gave them generic names, but we could take things a step further and name them geographically as in the NCAA Tournament. You can choose to think of these as the East, South, Midwest and West (or Erie, Pittsburgh, Scranton and Philadelphia?) regions if you’d like.
Here are the Region brackets after seeding was completed:

Results
I then simulated through each bracket using the well-known Massey Ratings. I used the site’s Matchup tool to come up with a score for every game in each of the four regions. In the interest of space, I’ve included the game results below for each round from the Round of 32 and beyond.
ROUND OF 32 RESULTS
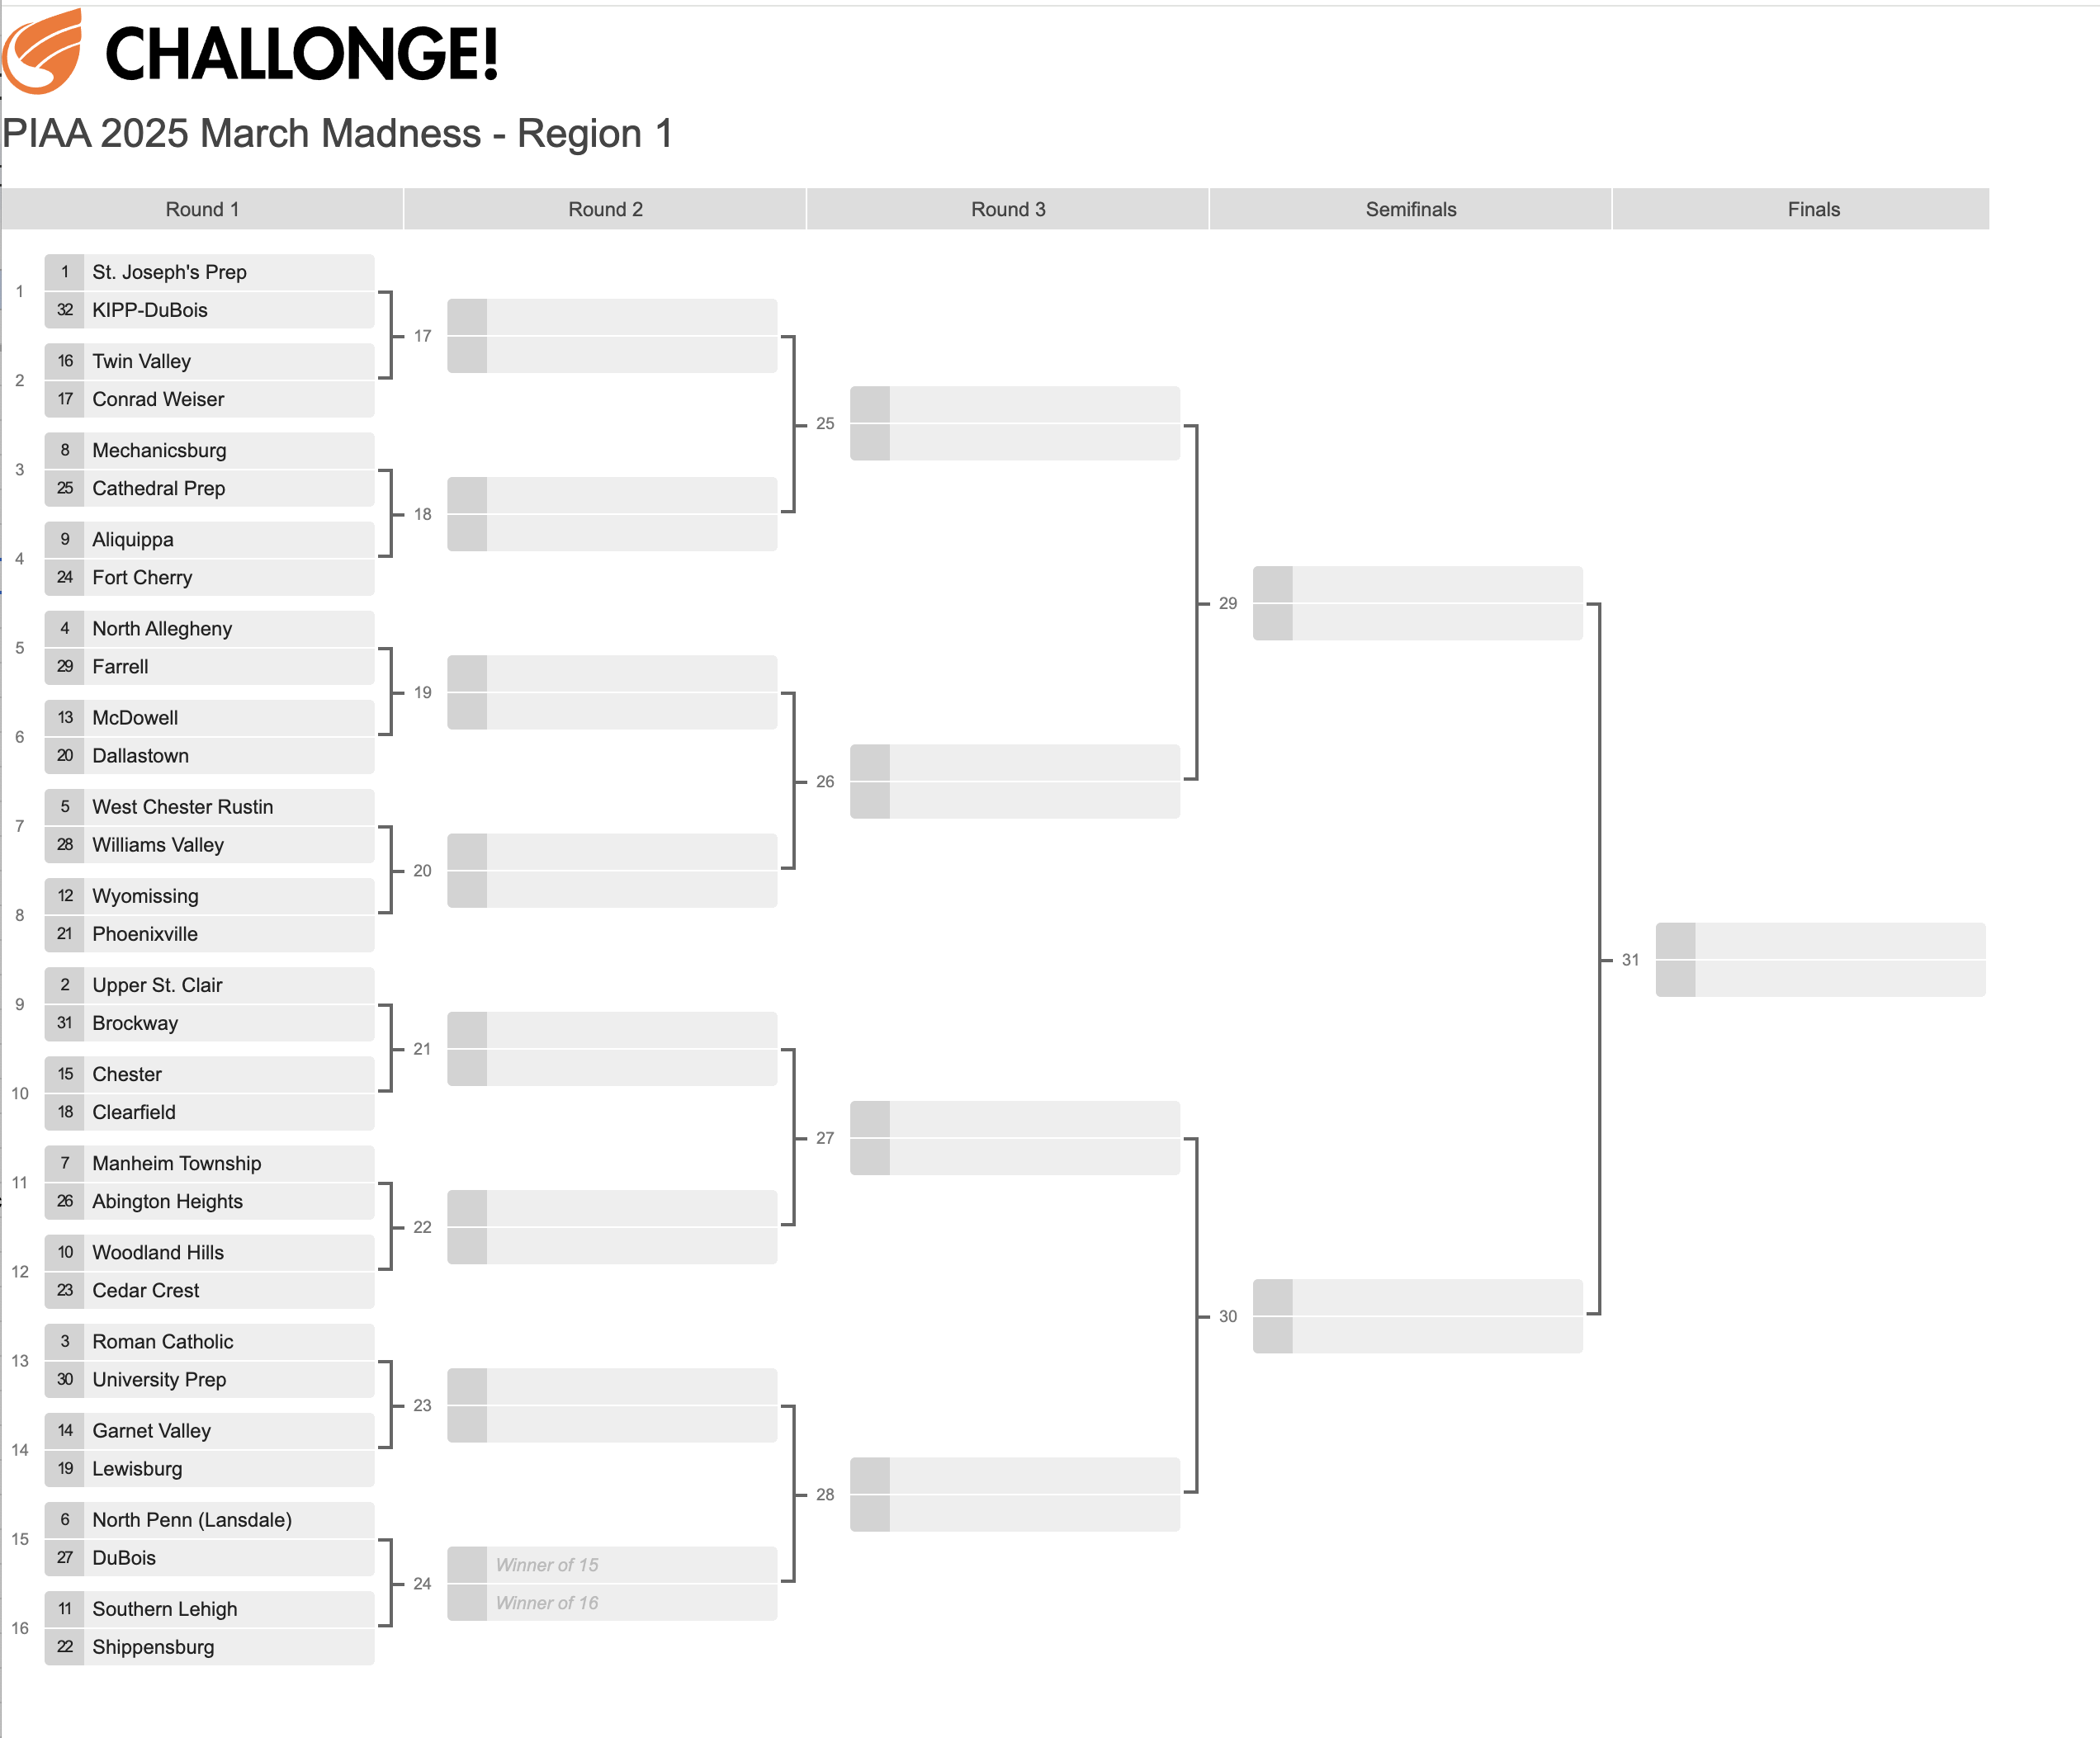
Region 1
(1) St. Joseph’s Prep 42, (9) Aliquippa 7
(4) North Allegheny 31, (5) West Chester Rustin 18
(2) Upper St. Clair 21, (7) Manheim Township 17
(3) Roman Catholic 35, (6) North Penn 20
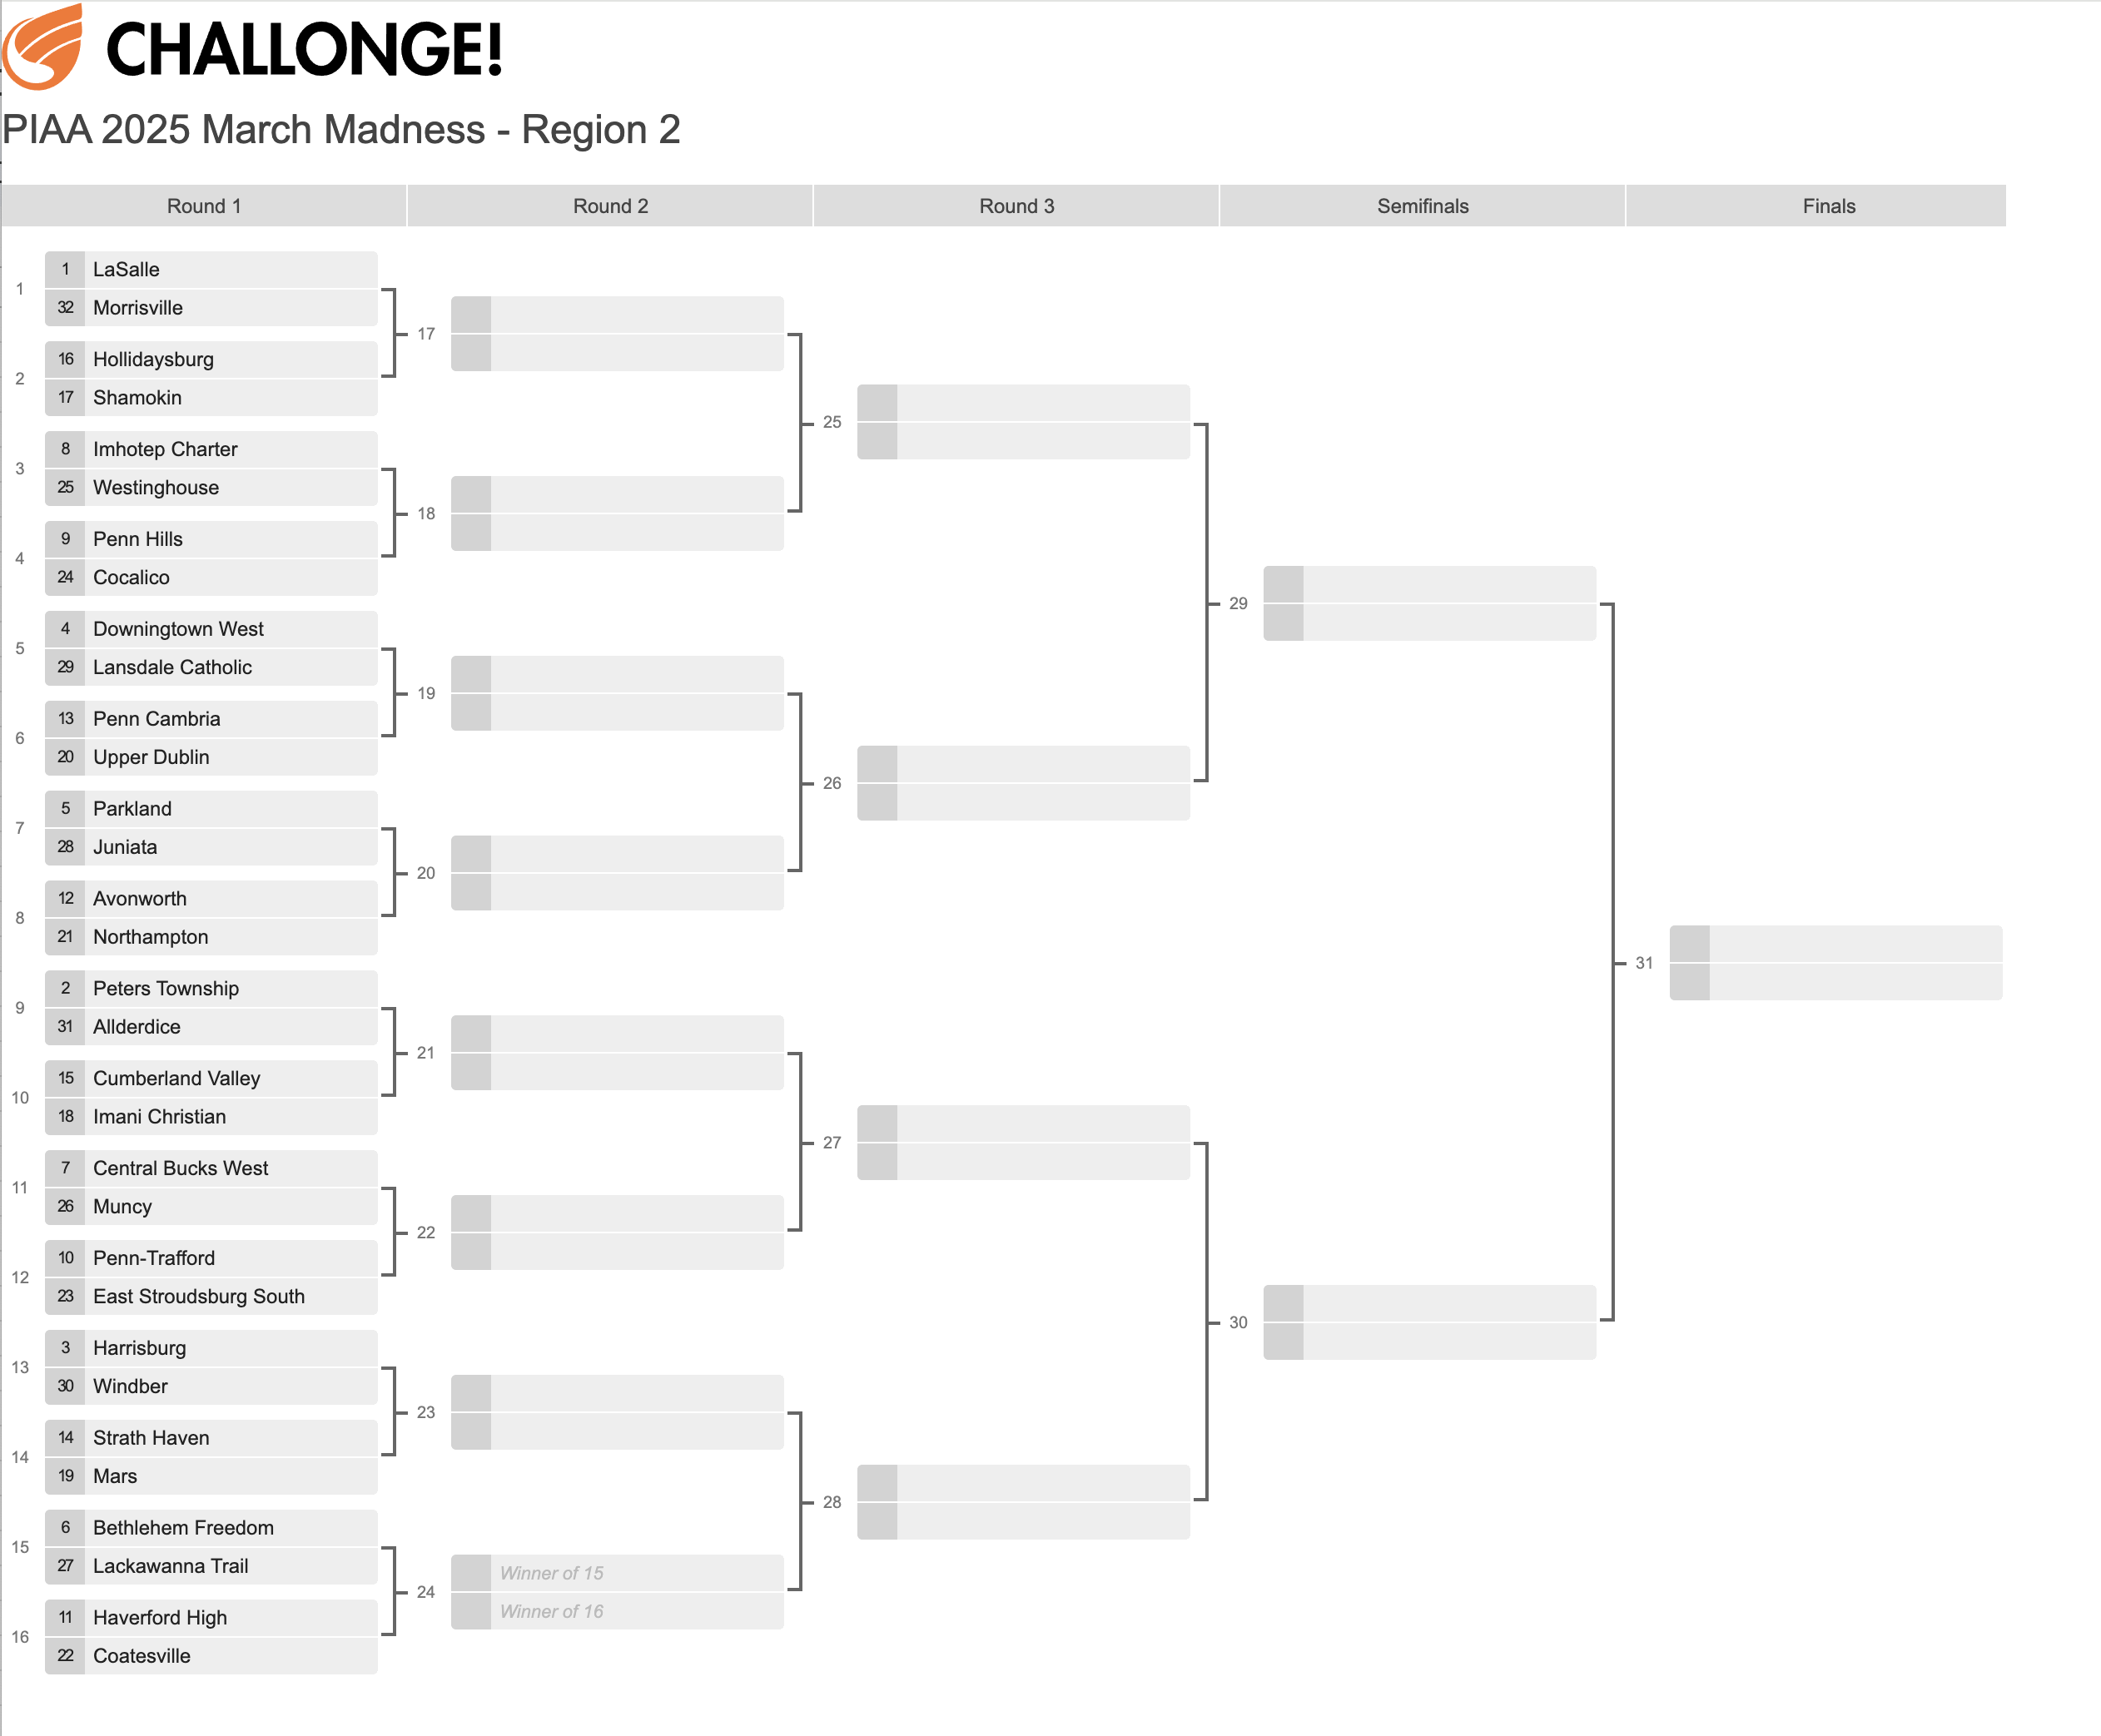
Region 2
(1) LaSalle 38, (8) Imhotep Charter 13
(5) Parkland 24, (4) Downingtown West 20
(2) Peters Township 27, (7) Central Bucks West 13
(3) Harrisburg 35, (6) Bethlehem Freedom 21
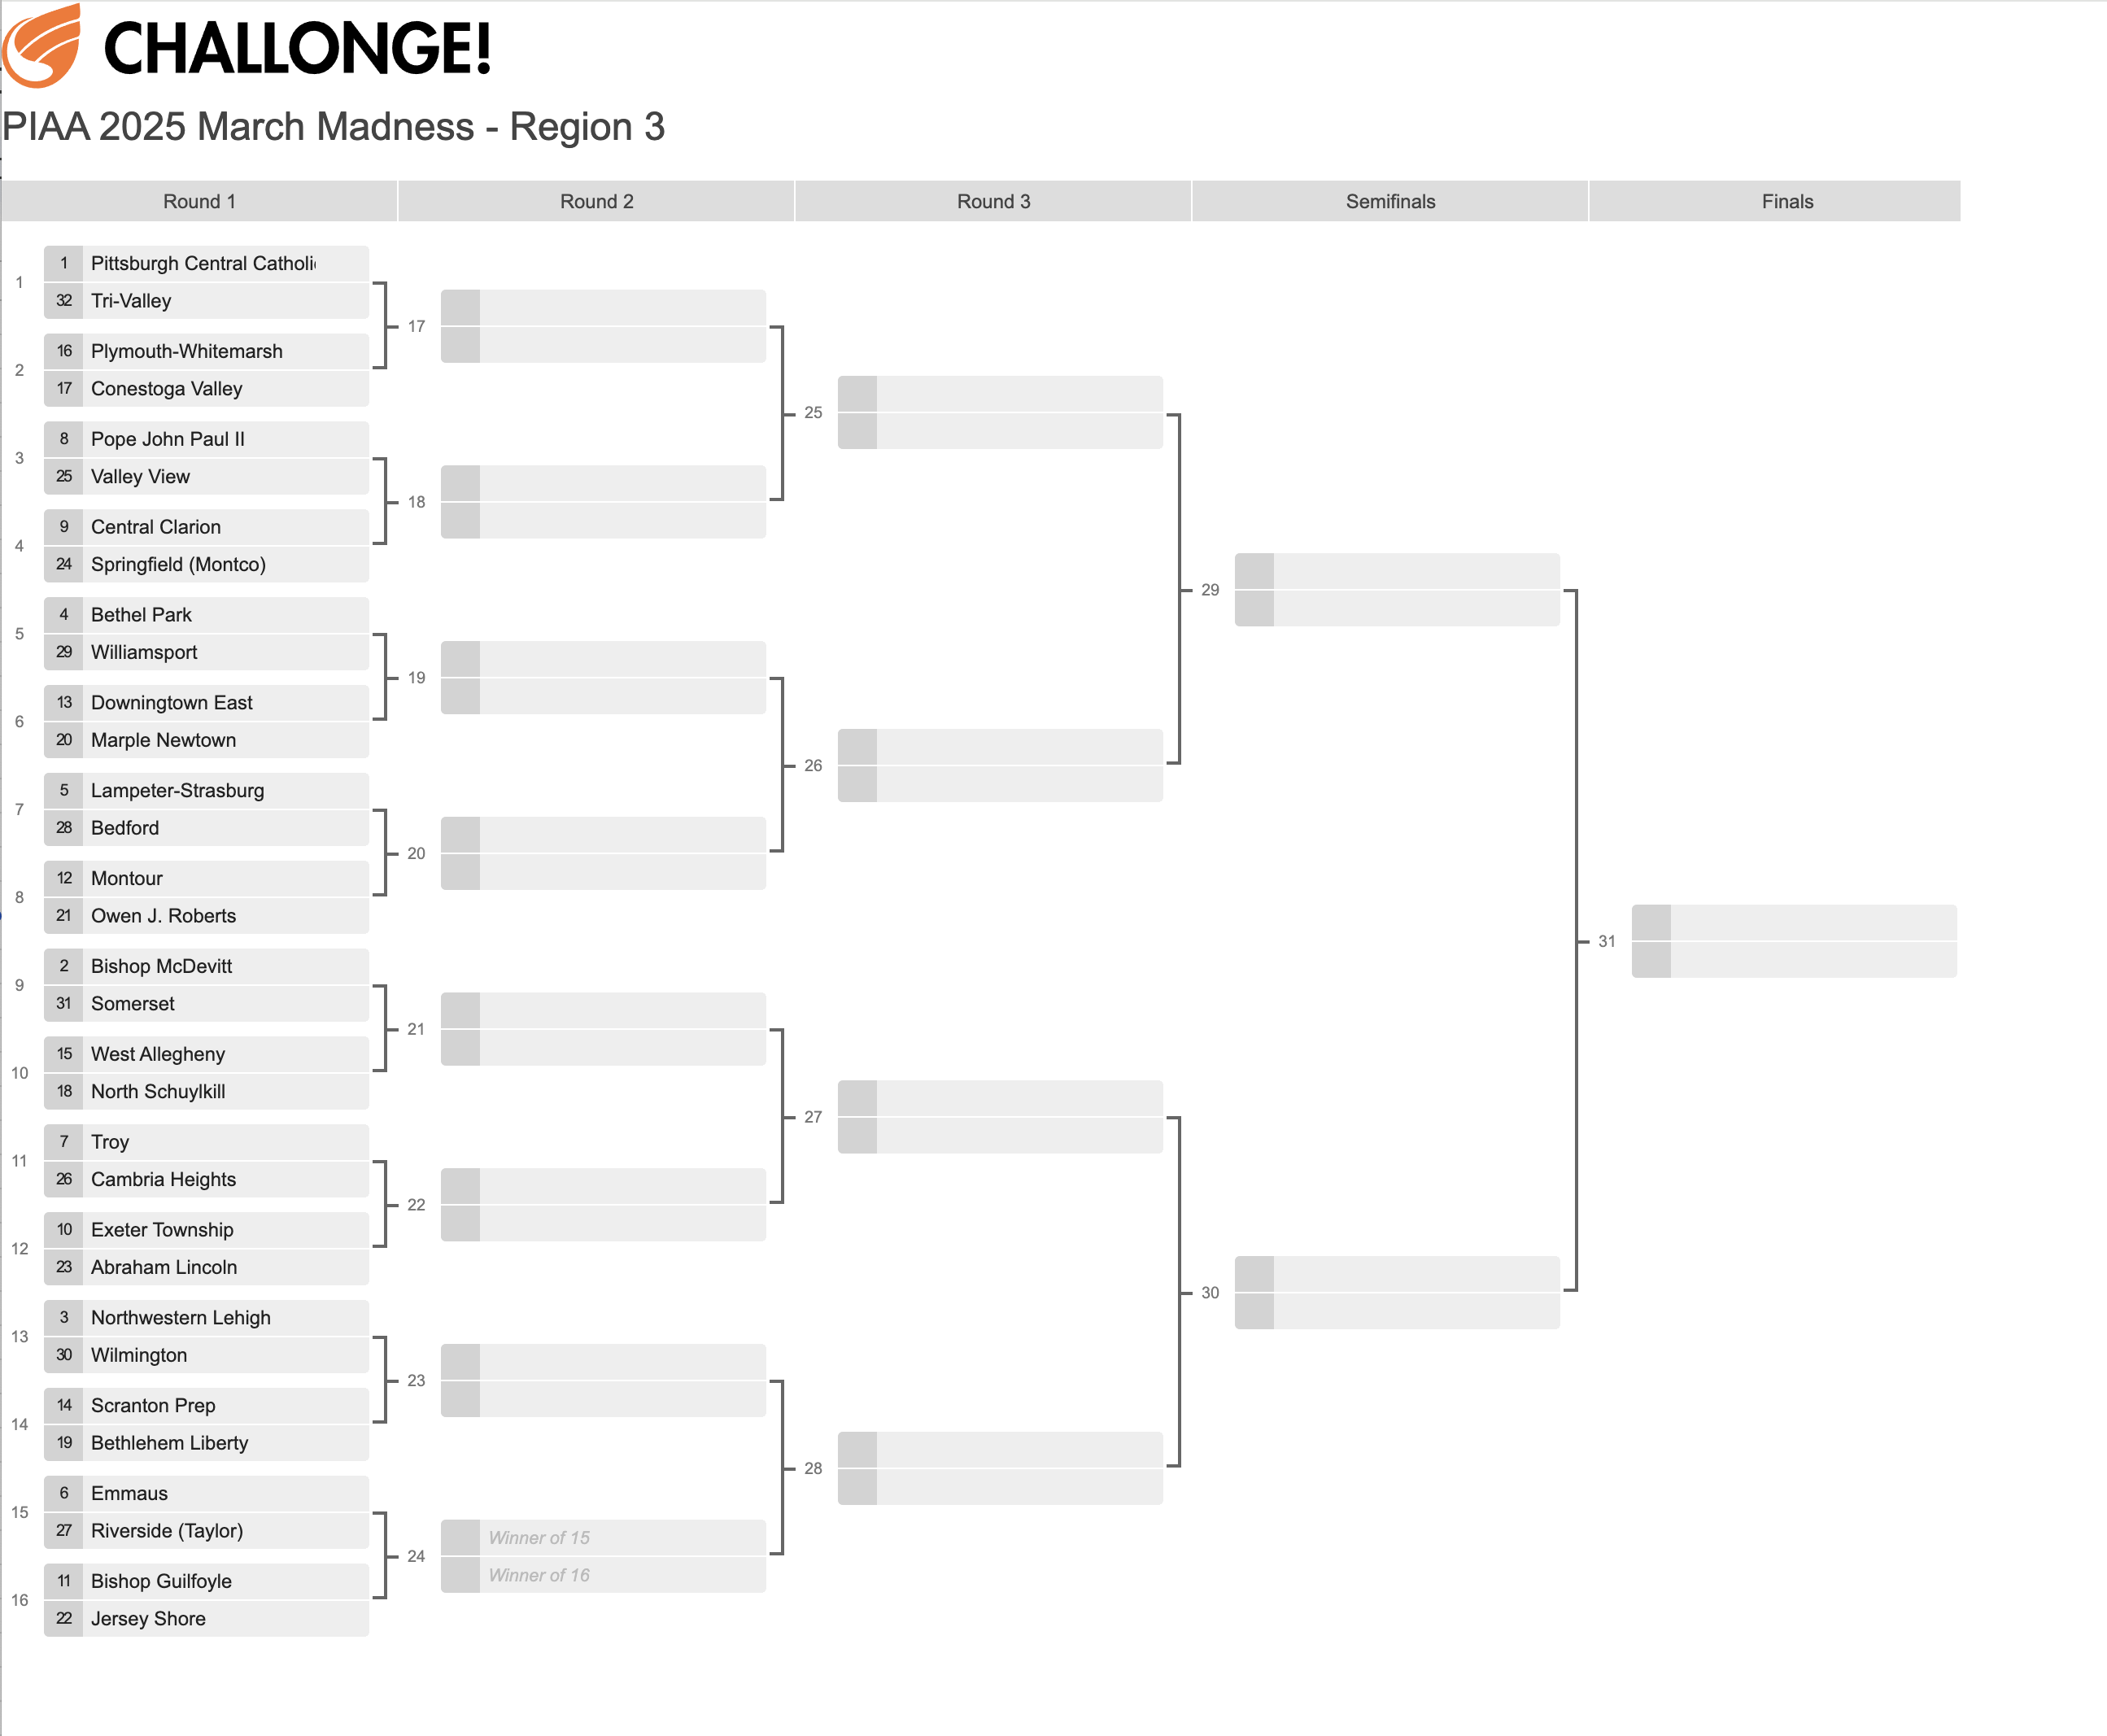
Region 3
(1) Pittsburgh Central Catholic 42, (9) Central Clarion 20
(4) Bethel Park 34, (5) Lampeter-Strasburg 24
(2) Bishop McDevitt 42, (10) Exeter Township 21
(3) Northwestern Lehigh 21, (6) Emmaus 20
Region 4
(1) Monsignor Bonner 28, (8) Springfield (Delco) 20
(4) Thomas Jefferson 21, (5) Central Bucks South 20
(2) Pine-Richland 35, (10) Central York 20
(3) State College 35, (6) Easton 21
SWEET SIXTEEN RESULTS
Region 1
(1) St. Joseph’s Prep 41, (4) North Allegheny 13
(3) Roman Catholic 27, (2) Upper St. Clair 24
Region 2
(1) LaSalle 34, (5) Parkland 10
(3) Harrisburg 26, (2) Peters Township 21
Region 3
(1) Pittsburgh Central Catholic 41, (4) Bethel Park 24
(2) Bishop McDevitt 35, (3) Northwestern Lehigh 21
Region 4
(4) Thomas Jefferson 28, (1) Monsignor Bonner 27
(2) Pine-Richland 28, (3) State College 25
ELITE EIGHT RESULTS
Region 1
(1) St. Joseph’s Prep 41, (3) Roman Catholic 14
Region 2
(1) LaSalle 28, (3) Harrisburg 14
Region 3
(1) Pittsburgh Central Catholic 36, (2) Bishop McDevitt 28
Region 4
(2) Pine-Richland 28, (4) Thomas Jefferson 18
FINAL FOUR RESULTS
Region 1 vs. Region 2
(1) St. Joseph’s Prep 31, (1) LaSalle 19
Region 3 vs. Region 4
(1) Pittsburgh Central Catholic 31, (2) Pine-Richland 21
STATE FINAL
(1) St. Joseph’s Prep 37, (1) Pittsburgh Central Catholic 21
So there you have it – 128 schools selected and organized into a whole-state bracket gives us a state championship game identical to the 2024 6A final (albeit with a slightly different score). These brackets were pretty chalky, which is to be expected when they’re based on computer rankings and don’t contain the variance of actual games between real teams that have to contend with weather, travel, injuries and the like. In the entire tournament, only four teams seeded 20th or worse won a game, all of them in the first round:
(22) Jersey Shore 35, (11) Bishop Guilfoyle 27
(22) Souderton 31, (11) Franklin Regional 21
(20) Upper Dublin 22, (13) Penn Cambria 21
(21) Northampton 28, (12) Avonworth 21
The scores of the games tended to be moderated toward the median, meaning that the range of scores was compressed more than they often are in real life. Computer ratings and projections are far from the be-all, end-all, so there were numerous results in this tournament that surprised me. In the end, though, most of the final teams shook out just about as expected.
If you’ve made it this far, I really appreciate your interest. I also feel terribly that you have the same sickness that I do, but at least we can have a little fun with high school football in the leanest days of the sport’s calendar.
