The State Championship Game Record Book has been updated with all of the 2024 title game statistics. Click the link below to follow along this weekend to see if any new records are set!
(I am still missing the penalty statistics for last year’s AA game between Troy and Central Clarion. If you have this data available, please let me know.)
*Feel free to use any and all information found here, but please credit PFH and Shayne Schafer if you use anything from this project. Thanks!
The state wins list has – finally – been updated and is complete through the 2024 season. Links can be found just below, but first I want to give the standard disclaimer for this list:
These numbers are based primarily upon the work of Dr. Roger Saylor, whose work can be found online via Penn State. Dr. Saylor completed these records through about 2009 (2010 for some schools), and then I have added to them in the years since.
My numbers likely differ from the numbers of other sources, including schools or local media outlets, for a few reasons. First, Saylor had a tendency to not count games played against non-academic institutions (YMCAs, alumni teams, etc.), but wasn’t always consistent with this. He was also doing this research largely in the days before the internet and compiled hundreds of thousands of game results by hand from newspaper reports. I still can’t wrap my mind around this Herculean task, but that also means that there are likely some missing games in some teams’ files. I do think that the Saylor Sheets are accurate to a high degree, especially considering the methods Saylor had to use to create them. If you feel that your school’s all-time record as shown here is incorrect, let me know and provide any resources you can to help me correct it.
There is also the issue of who to issue wins to when a school ends up merging or participates in a co-op. I’ve admittedly been a little inconsistent with this over the years, but I’m trying to sort through these in the most accurate way possible. I’ve come around to the idea that a school should be treated as a new entity any time its student population changes. This will take me some time to untangle in these numbers and will cause some pretty big changes in the Wins List over time (including for some high-ranking programs). If you feel that I’ve bungled one of these situations, please reach out.
The Lists
The links to various arrangements of the Wins List are included below:
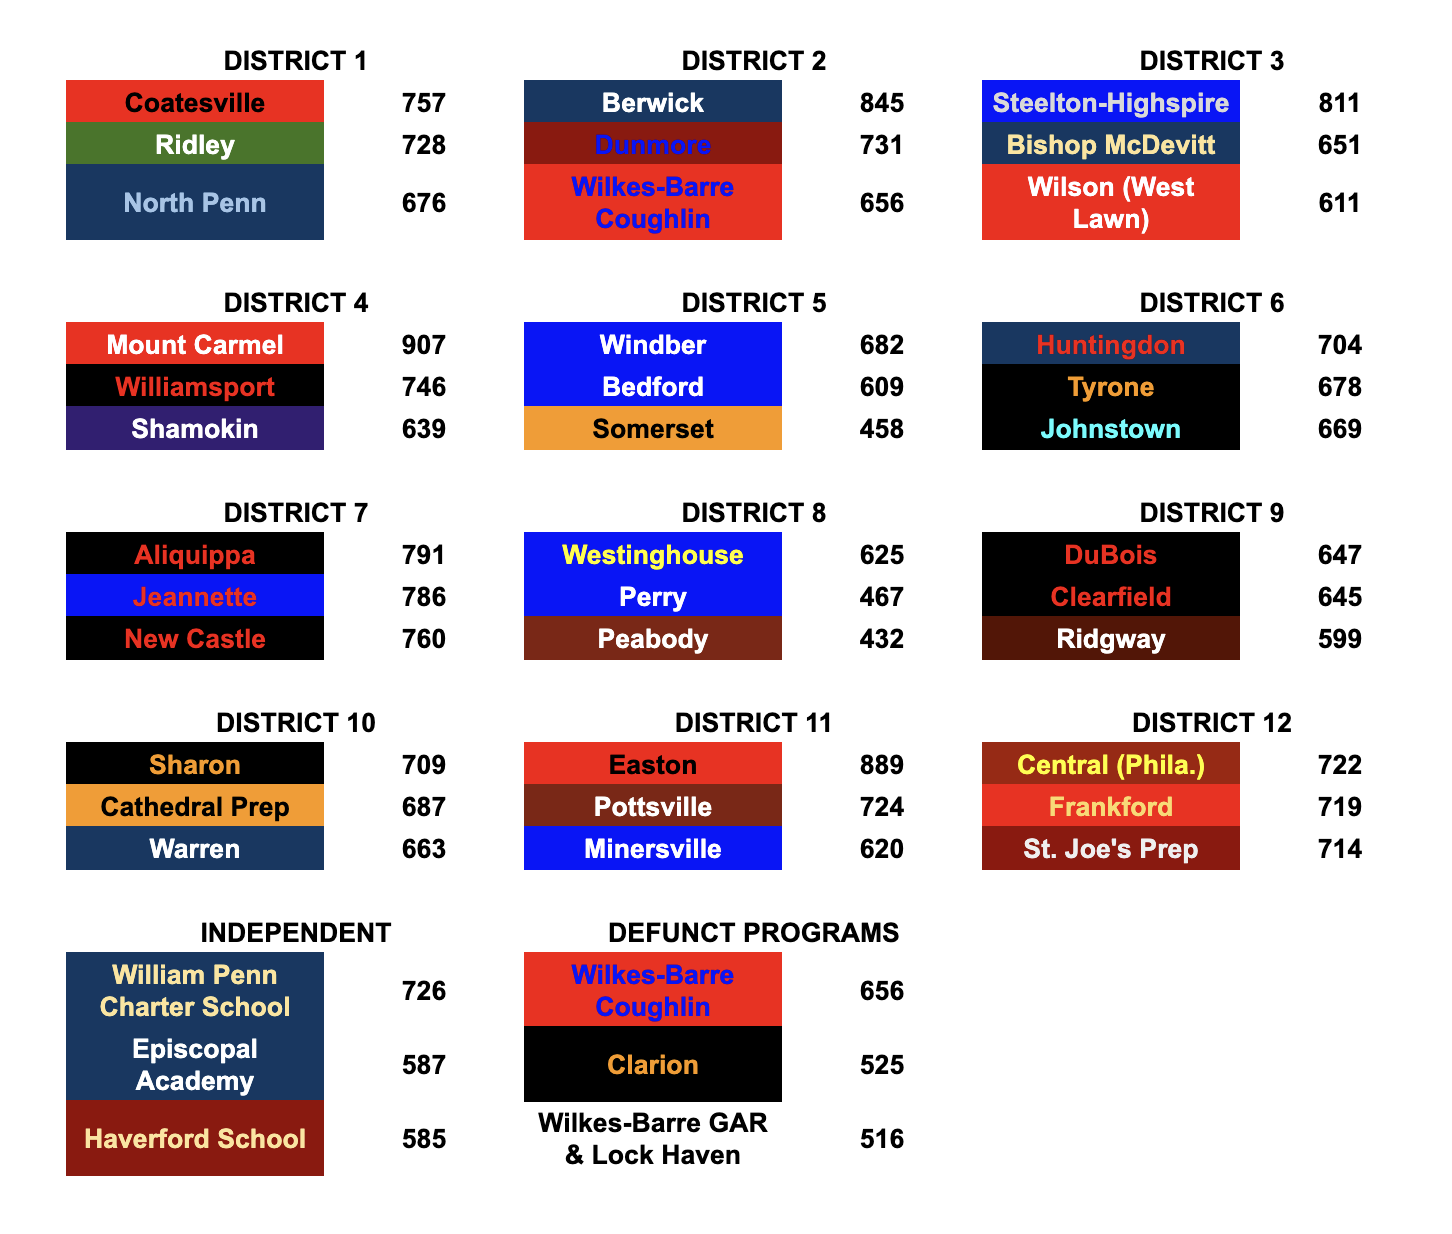
Mount Carmel became the first Pennsylvania school to win 900 games last fall and now sits at 907, putting its lead over Easton at 18 wins.
The list of schools with at least 700 wins is now at 23. Sixty-seven schools have won at least 600 games and there are now 158 schools with 500+ wins.
The three winningest teams in each district, along with the leaders for independent schools and schools that no longer field football programs:
154 schools have played at least 1,000 games. Pennridge and South Williamsport will both reach that milestone on opening night this season; Somerset will join the club the following week.
Blakely remains the program with the highest winning percentage all-time (.817) and will likely hold that crown for a very long time. The school went 252-51-14 from 1936 to 1968. Second-place Central Valley (.786) has played 125 fewer games than Blakely to this point. The Warriors would have to go 108-17 over that stretch to take the number one spot. Central Clarion also has a .786 winning percentage, but has played only 56 games so far.
How many active programs are exactly .500 all-time? Two: Saucon Valley (372-372-10) and Upper Merion (458-458-34). Quakertown’s record rounds to .500, but it is actually 539-540-46 since 1908. Several other defunct programs were also exactly .500, but aside from Coraopolis (which went 247-247-37 from 1905 to 1970), none of them played more than a handful of games.
The most unbreakable record in Pennsylvania high school football that nobody ever talks about? Chester’s 89 ties. Ties aren’t exactly impossible anymore, but they require unusual circumstances to occur (weather delays in games that can’t be completed later, etc.). Second place on the all-time ties list is Scranton Central, which hasn’t fielded a football team in 35 years and has 70 ties. The closest active program to Chester is New Castle with 69. It’s safe to say that no school is making up a 20+ tie gap, so the record is Chester’s forever.
Finally, for the not-so-fun list. Here are the ten programs to lose 600+ games in their histories:
I’m going to warn you right now: this post was born from a combination of boredom and a fairly stupid idea.
We’re in late March, essentially the dark side of the Moon when it comes to the high school football calendar. The 2024 season is falling further and further behind us with each passing day, yet the 2025 season doesn’t feel particularly close yet. One of two things will happen regarding high school football discussion at this point of the calendar: it’ll fall to the back burner or we can throw mud at the wall and conjure up ridiculous scenarios.
For the past several years, Shayne Schafer has taken the reins on maintaining the state championship game record book that we’ve posted. Once again, Shayne has come through and updated the file well in advance of this week’s games at Cumberland Valley. Take a look below!
*Feel free to use any and all information found here, but please credit PFH and Shayne Schafer if you use anything from this project. Thanks!
The 89th NFL Draft was held over the weekend and, for the 89th time, Pennsylvania high school alums were selected. While the state can claim to have had players picked in every NFL Draft to this point, the historical trends have shifted considerably over time. I’ll include any trends or observations that I found interesting below, but let’s start with a recap of Pennsylvania’s six selections in 2024:
This Year’s Selections
Marvin Harrison, Jr. (Arizona Cardinals, 1st Round, 4th Overall)
St. Joe’s Prep’s 11th NFL Draft pick and first since the trio of D’Andre Swift, John Reid and Jon Runyan in 2020. Harrison spent his freshman year at LaSalle; he is the first former LaSalle player to be selected since Jimmy Morrissey in 2021 and the 7th Explorer chosen all-time.
Harrison was the highest pick from Pennsylvania since Archbishop Wood’s Kyle Pitts was taken 4th overall by the Falcons in 2021. Saquon Barkley of Whitehall went 2nd overall in 2018.
Harrison is the 68th wide receiver from Pennsylvania to be chosen in the NFL Draft and the first to be selected in the first round since Nazareth’s Jahan Dotson two years ago. Harrison’s father Marvin Sr. (a Roman Catholic grad) was the 19th overall selection as a wide receiver in the 1996 Draft.
At 4th overall, Harrison is tied for the highest selection ever by a Pennsylvania wide receiver. In 1962, Williamstown’s Gary Collins was also taken 4th overall by the Browns. In 1950, Turtle Creek’s Leon Hart went first overall as an end, but that position was much closer to today’s tight end than a wide receiver.
Jared Verse (Los Angeles Rams, 1st Round, 19th Overall)
Not long after Harrison became the 95th first round pick in Pennsylvania history, Verse became the 96th.
Verse is just the second player from Central Columbia to be chosen in the NFL Draft, joining Mike Morucci. Morucci was picked in the 7th round (177th overall) by the Saints in 1980 as a running back out of Bloomsburg University.
The fifth player from Pennsylvania drafted out of Florida State, Verse is also the 77th player to be selected by the Rams.
Verse is the highest-drafted Pennsylvanian defensive lineman since Penn Hills’ Aaron Donald was taken 13th overall in 2014.
Tykee Smith (Tampa Bay Buccaneers, 3rd Round, 89th Overall)
The 4th NFL Draft pick from Imhotep Charter, joining David Williams and DJ Moore (both in 2018) and Shaka Toney (2021).
Smith is the 16th Pennsylvania draft pick chosen from Georgia and the first since Mark Webb of Archbishop Wood in 2021.
Jeremiah Trotter, Jr. (Indianapolis Colts, 5th Round, 155th Overall)
Trotter was the second St. Joe’s Prep grad to be chosen in 2024, giving the school two drafts with multiple players selected in the past five years.
Trotter is the seventh Pennsylanian to be selected from Clemson, but the first since Valley Forge Military Academy’s Jim Bundren was chosen in 1998.
He is the 122nd linebacker drafted from a Pennsylvania high school, which is the fifth most-drafted position from the state.
Hardy is the 12th Penn Hills graduate to be selected in the NFL Draft, tying the school with Bethlehem Liberty, Beaver Falls and Mt. Lebanon for the ninth-most picks in state history.
First Penn Hills player to be selected since Donald.
Hardy is the 191st Pennsylvanian to be selected out of Penn State, the most of any university.
Devonshire is the 15th draft pick from Aliquippa, the fifth-most of any high school in the state. He is the first Quip to be selected since Tommie Campbell was chosen in 2011.
He is the 177th selection from Pennsylvania to play collegiately at Pitt, which is second only to Penn State.
He is the 25th Pennsylvania player to be selected by the Raiders, but only the second (joining fellow Pitt alum Morrissey) to be chosen during the team’s time in Las Vegas.
Historical Trends
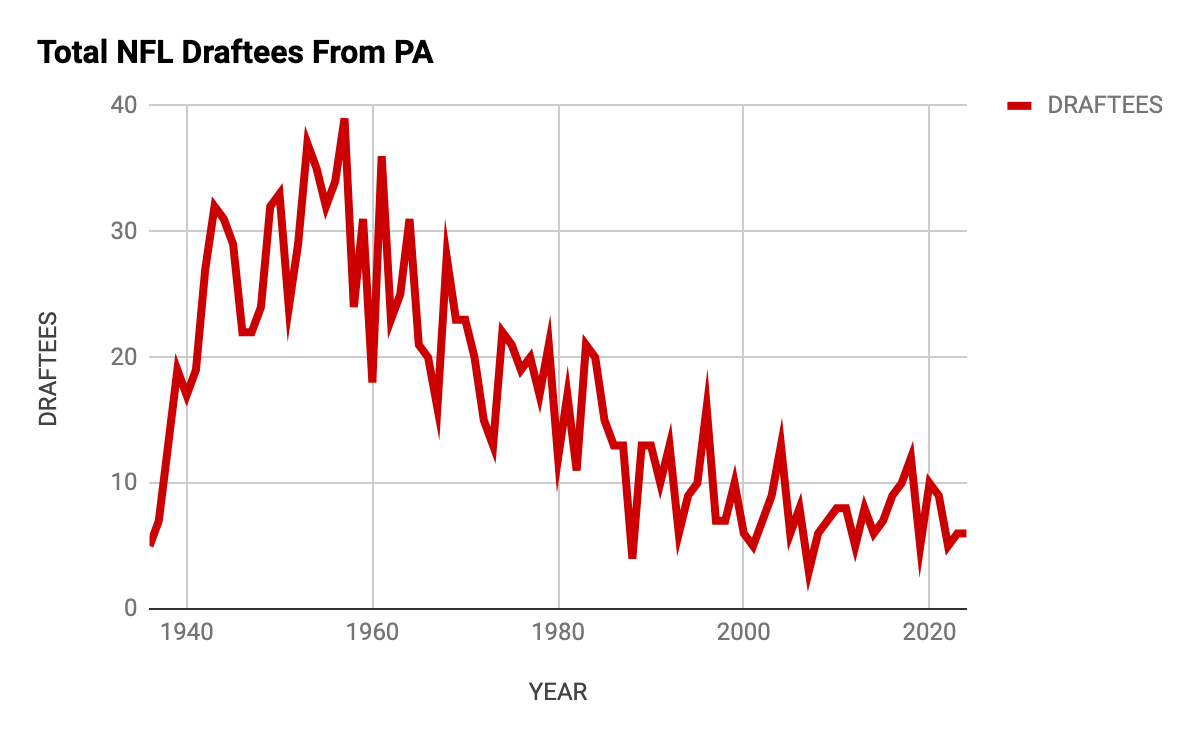
Pennsylvania’s six total selections this year equaled last year’s total and held serve with the state’s typical output this century. Since 2000, an average of 7.36 Pennsylvania high school alums have been chosen each year. However, the state historically has produced many more draft picks on an annual basis, as can be seen in the chart below:
From 1938 through 1987, the number of Pennsylvanians picked each year never dipped below double-digits. In fact, twenty or more players were chosen in all but two drafts from 1942 through 1971. The high-water mark was 1953, when 37 players from PA were chosen.
As one would predict, Penn State and Pitt hold a commanding lead over all other universities in producing draft picks with Pennsylvania natives. All colleges with at least 15 draft picks are shown below:
Harrison and Verse gave Pennsylvania two first round picks for the 26th time. The other occurrences are shown below (click to enlarge):
Finally, here are a few quick lists of the most popular characteristics of PA high school alums in the NFL Draft:
First, I’ve added a sheet where you can view the first and latest date any team was ranked by the Patriot-News. Note that some schools show the ranking dates as “12/30/1899”; this is just Google Sheets’ way of saying “they’ve never been ranked.”
Second, due to page loading errors and crashing caused by a WAY-too-big spreadsheet, I’ve broken the all-time ranking sheet into more manageable chunks. Hopefully this allows everyone to look at the data, albeit in three sections.
Just in time for the start of the 2023 season, the Wins List has been updated to include all results through the end of the 2022 season.
I want to be crystal clear with this: this project is a continual work in progress. There are bound to be schools that contact me saying their record is wrong – that’s fine! It’s my goal to make sure the numbers presented here are as accurate as humanly possible. But please don’t just tell me they’re wrong – tell me what the RIGHT numbers are and show me why. Email me at pafbhistory@gmail.com or contact me on Twitter @pa_fb_history. Together, we can improve this list over time to make it the most accurate that it can possibly be.
The fully published lists can be found at the bottom of this post. Fun facts, milestones, and observations are listed below.
(You can use your browser’s search function to find your school’s name below)
500 – Brockway (499), Radnor (498), Westmont Hilltop (497), Punxsutawney (497), Thomas Jefferson (496), Jersey Shore (495), Pottstown (495), Littlestown (494), Meadville (494), Hanover Area (493), Uniontown (492), Canton (492), Columbia (492), Milton (492), Ligonier Valley (489), Upper St. Clair (486), Kiski Prep (486), Coudersport (486), Lebanon (485)
400 – Cocalico (399), Harbor Creek (399), Boyertown (399), Leechburg (398), Pine-Richland (397), Father Judge (396), York Catholic (396), Blue Mountain (396), Brookville (396), Norwin (396), Northern Bedford (395), Canon-McMillan (392), Central York (391), Juniata Valley (391), Lansdale Catholic (390), Moshannon Valley (390), Perkiomen School (388), Biglerville (388), South Western (385), Spring-Ford (385)
300 – Susquehanna Community (297), Neshannock (297), Otto-Eldred (297), Pine Grove (297), Sheffield (297), Burrell (297), Spring Grove (294), Bethlehem Freedom (292), George School (292), Susquenita (291), South Side Beaver (290), Riverside [7] (289), William Tennent (288), Central Bucks East (286), North Pocono (286), Highlands (285), Pittston Area (285), Honesdale (285)
200 – Conemaugh Valley (199), Penn Manor (197), Cornell (195), Kennedy Catholic (194), Palisades (194), Western Wayne (192), Southmoreland (191), South Allegheny (189), North Star (187)
100 – New Hope-Solebury (98), Kutztown (93), Central Mountain (85)
GAMES PLAYED
1,300 – Mount Carmel (currently at 1,288)
1,200 – Shikellamy (1,199), Roman Catholic (1,199), Sharon (1,196)
1,100 – Jersey Shore (1,095), Haverford School (1,093), Charleroi (1,093), Scranton (1,092), Meadville (1,089), Windber (1,087), Grove City (1,085)
1,000 – Cathedral Prep (998), East Pennsboro (998), Emmaus (998), Hanover (997), Muncy (997), Hill School (996), Mars (996), Avonworth (994), Burgettstown (992), Hatboro-Horsham (990), Juniata (989)
900 – Kiski Prep (899), West York (899), West Perry (898), Neumann-Goretti (897), Riverside [2] (895), Union Area (895), Overbrook (891), Mohawk (889), Jefferson-Morgan (888), Girard (885)
800 – Pottsgrove (798), Richland (798), Boiling Springs (798), Muhlenberg (795), Hopewell (795), Pine Grove (793), Littlestown (792), John Bartram (789), Lower Moreland (788), Manheim Township (787), Otto-Eldred (786)
700 – Bethlehem Catholic (699), Franklin Regional (699), Pine-Richland (697), Northern York (696), Chestnut Ridge (695), Kennard Dale (695), Gateway (694), Northern Cambria (694), Upper St. Clair (691), Cedar Cliff (686)
600 – Glendale (598), Montrose (592), Salisbury (591), Bentworth (589), Seneca Valley (586), Perkiomen Valley (585), North Penn [Mansfield] (585)
500 – Wallenpaupack (490), Kennedy Catholic (490), Kutztown (488), Martin Luther King (487)
Pennsylvania high school football entered a new chapter in 1988 with the birth of the statewide playoff system. This created a path for teams to be crowned state champion (on the field, anyway) for the first time.
This new era led to the creation of the first subjective statewide polls, which the Harrisburg Patriot-News began that same year. In this database, all presently known state rankings have been documented. I’ll break up the rest of the important info in bullet points below, and then we’ll take a look at some trends, interesting facts, etc., at the end of this post.
What to Know About This Database
PLEASE look over this section before digging into the data, as many of your questions will be answered here:
There are missing weeks in this dataset. As of the end of the 2022 season, there are about 577 weeks where we’d expect rankings from the P-N. This dataset has 546 weeks completed as of the posting of this article, so 94.6% of the rankings are input and complete. Not bad! But I’m still searching for 30 hard-to-find rankings to complete the set. Those missing weeks can be found below; if you have any info that can help me fill in these blanks, please let me know.
Honorable Mention selections were not made in the preseason rankings fr 1989 and 2020. Additionally, no rankings were published for Week 1 in 2020.
To my knowledge, the Patriot-News rankings were the first subjective statewide rankings in Pennsylvania. Other mathematical systems (like the Saylor Ratings and Dunkel Index) had been published prior to 1988. The Patriot-News rankings were compiled by Rod Frisco from 1988 through about 2009. Since then, they’ve been selected by Eric Epler.
This database currently consists of 47,833 entries. Due to this size, there are bound to be small errors here and there, but a lot of time has been spent making sure this database is as accurate as possible. At times, there were errors in the rankings themselves, like a team being ranked 10th AND as an Honorable Mention or other copyediting mistakes, and those have been corrected in this database. In 1990 and 1998, Whitehall was ranked in one classification for part of the year, and then a correction was made in later weeks. The same thing happened to Bellwood-Antis in 2019, Cambridge Springs in 1989, and may have occurred other times that I haven’t caught yet. I’ve chosen to leave these rankings alone for the time being, but may correct them at a later time.
I made one edit to the state rankings, but I think I was justified to do so. In the 1997 Class A Final rankings, Riverside (Taylor) was No. 1 and Sharpsville was No. 2. However, Sharpsville had beaten Riverside, 10-7, in the state title game a few days before. I’m feel confident that this was a typo or a transcription error of some sort, but if someone can correct me, I’ll switch the rankings back.
Teams have been listed in the tables by the name the school had prior to any consolidation or split. So you’ll see a row for Downingtown, a row for Downingtown East, and one for Downingtown West, for example.
Teams were also listed with the district they were a member of in that year. For example, early years will show Mount Carmel in District 11, while more recent years will have them in District 4. The only exception to this involves the old District 12. Prior to the late 1990s (I believe), the PIAA designated teams in the far Northeastern part of the state as District 12 before folding them into District 2. To prevent confusion with the current District 12 (the Philadelphia Public & Catholic Leagues), I used District 2 for all of these schools throughout their ranking histories.
Some of the tables shown here have “Rank Points” and “Average Rank Points” columns. This was just an informal way to tally the quality of each team’s ranking at a raw and average level. Points were assigned similar to a track meet or the college football AP poll (10 points for 1st, 9 points for 2nd, etc.). A higher average means a team is ranked highly more often than a team with a lower average.
A Few Notable Things About the Data…
Let’s get to the fun part. You can find links to the data at the bottom of the post, but let’s dig in and look at a couple interesting things here:
The first-ever top-ranked teams? In 1988, the preseason Number 1 teams were North Hills (4A), Aliquippa (3A), Sto-Rox (2A) and Dunmore (1A). Names that have had relevance over the years, to say the least.
The number of Honorable Mention teams in each class has remained fairly stable over Epler’s tenure, especially since the advent of six classes. Most weeks, each class has between five and seven HM teams. Frisco, particularly in the 1990s, named many more HM teams per class. Some weeks featured as many as 24 HM teams in one classification. However, I don’t think this has dramatically impacted the overall data. Below is a chart showing how many total teams were ranked each year. It’s been fairly level over time when you take into account that some dips are due to years missing several weeks (and COVID shortening the 2020 season, of course).
Total teams to be ranked No. 1 all-time? 112. I don’t know about you, but this number was quite a bit higher than I had expected.
Southern Columbia has been ranked for 535 weeks, 200 of which at No. 1. Both are most in the state. This means the Tigers have been ranked for 98% of known weeks since 1988. They’ve been No. 1 for nearly 37% of those weeks.
Here are the 15 schools with the most weeks at No. 1:
TEAM
WEEKS AT NO. 1
Southern Columbia
200
Aliquippa
144
Berwick
126
Clairton
113
St. Joseph’s Prep
112
Thomas Jefferson
94
Archbishop Wood
82
Central Bucks West
73
Farrell
67
Pittsburgh Central Catholic
64
Mount Carmel
61
Cathedral Prep
58
Upper St. Clair
50
Strath Haven
49
Imhotep Charter
42
Weeks at No. 1 by PIAA District:
DISTRICT
WEEKS RANKED NO. 1
1
185
2
237
3
171
4
310
5
0
6
26
7
916
8
14
9
2
10
154
11
129
12 (since 2008)
262
Percentage of all ranked teams to come from each district:
DISTRICT
PERCENTAGE OF ALL RANKED TEAMS
1
9.8%
2
7.2%
3
15.7%
4
6.5%
5
1.7%
6
8.6%
7
25.5%
8
0.8%
9
3.7%
10
8.1%
11
9.7%
12
2.6%
Of the 95% of weeks found so far, 51.6% of ranked teams come from the Eastern part of the state (Districts 1, 2, 3, 4, 11 & 12), while 48.4% come from the West.
Teams with the most weeks ranked at each spot:
RANK SPOT
TEAM
WEEKS AT THAT SPOT
1
Southern Columbia
200
2
Manheim Central
86
3
Aliquippa & Rochester
64
4
Southern Columbia
73
5
Manheim Central
44
6
Wilmington
41
7
Manheim Central
37
8
Bellwood-Antis
44
9
Berwick & Bellwood-Antis
33
10
Clearfield
28
HM
Wilson (West Lawn)
173
One more table, just for fun. Here are the schools with the most all-time weeks in the rankings without rising above a certain spot. In other words, Wilson has been ranked for more weeks than any other school that has not reached No. 1. As always, remember that this data is only based on the 95% of found rankings and may change as additional weeks are input:
With the 2023 NFL Draft beginning Thursday, let’s take a look at the history of Pennsylvania high school graduates throughout the history of the draft. The following data is as complete as I could make it at the moment, but small tweaks will likely be made if and when additions and corrections are to be found.
Here is a list of every player from a Pennsylvania high school who has been drafted into the NFL since the first draft in 1936.
Here is a list of every Pennsylvania player drafted into the AFL (1960-1966).
Here are all of the players from Pennsylvania drafted into the short-lived All-America Football Conference (1947-1949).
[UPDATE: Thanks to the suggestion of Bob Greenburg, I’ve added a list of players drafted by the NFL, AFL, and AAFC sorted by their high school. Now you can easily view every draftee from a high school. Here is the link.]
On a school-by-school basis, eight high schools have had at least 15 draftees (counting players twice if they were picked by two leagues) across these three professional leagues. All of these schools are current WPIAL members with the exception of Bethlehem Liberty, Johnstown (which left the WPIAL in 2000), and Altoona, which has been a WPIAL member at times over the years.
HIGH SCHOOL
DRAFTEES
McKeesport
25
Pittsburgh Central Catholic
23
Uniontown
19
Aliquippa
17
Johnstown
17
Clairton
16
Altoona
15
Bethlehem Liberty
15
Bethlehem Liberty (15), Allentown Allen (14), Hazleton (13) have the most selections by non-WPIAL schools. This total includes players who may have attended multiple schools (such as Micah Parsons, who gives both Central Dauphin and Harrisburg one draft selection each). There are likely a few inconsistencies in this list due to high schools changing their names over the years (like Neumann-Goretti, which used to be St. John Neumann High School), but this data should be nearly entirely complete. See the list of every school with a draftee here.
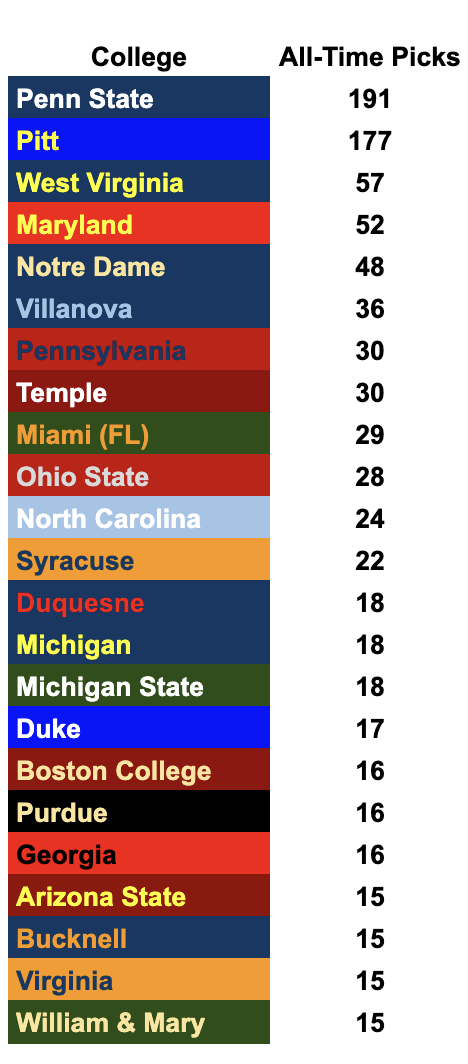
There likely aren’t many surprises when it comes to the most common colleges attended by Pennsylvania HS grads who were drafted, other than perhaps Miami’s presence in the top 10:
COLLEGE
DRAFTEES
Penn State
188
Pitt
175
West Virginia
57
Maryland
51
Notre Dame
48
Villanova
36
Pennsylvania
30
Temple
30
Miami (FL)
29
Ohio State
27
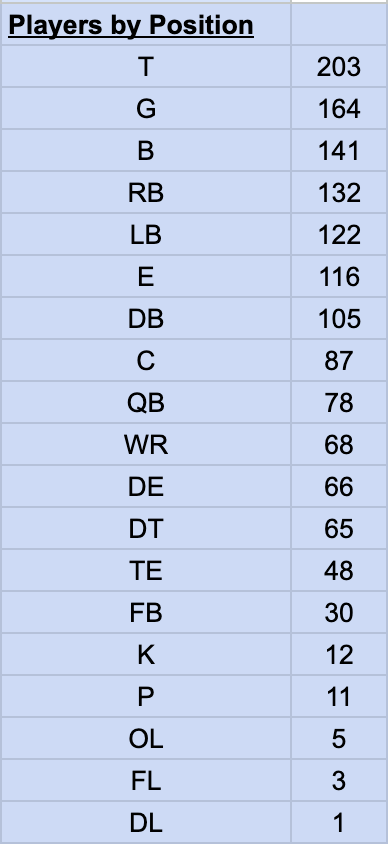
Player positions are sometimes very fluid in the draft process and players in the two-way era were usually only listed by their offensive position, but here are the ten most common positions played by Pennsylvania grads who were drafted:
POSITION
DRAFTEES
Tackle
202
Guard
164
Back (TB, HB, FB, etc.)
140
Running Back
132
Linebacker
121
End
115
Defensive Back
104
Center
87
Quarterback
78
Wide Receiver
67
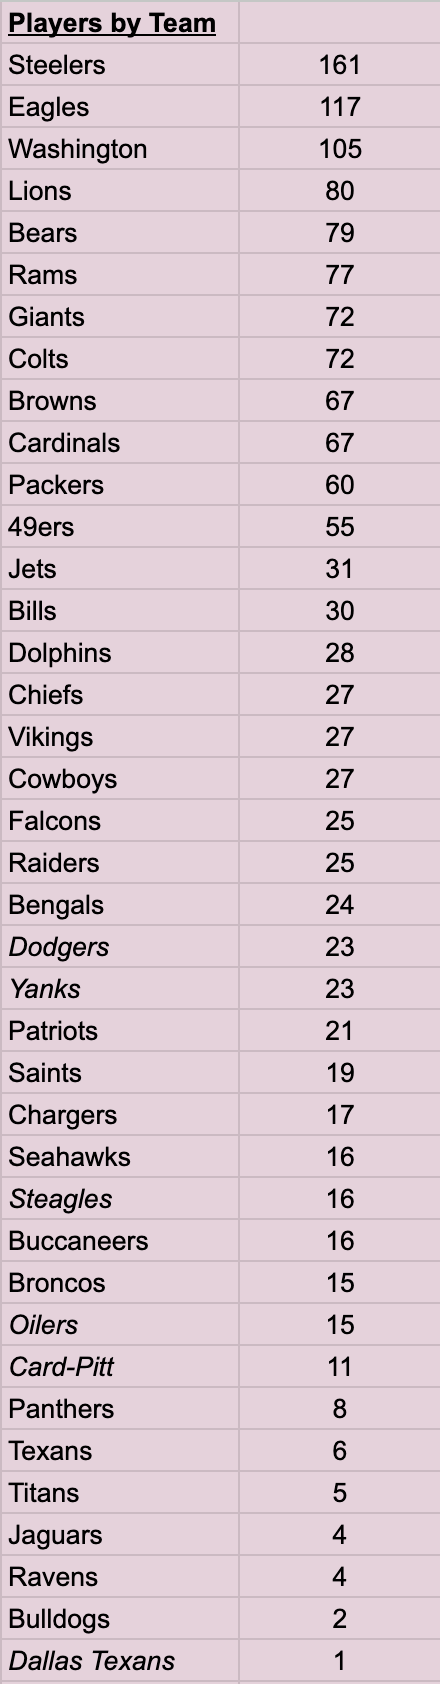
As for the teams that have drafted the most Pennsylvanians, there aren’t many surprises here, either:
TEAM
DRAFTEES
Steelers
160
Eagles
117
Washington
105
Bears
79
Lions
79
Rams
75
Giants
72
Colts
71
Browns
67
Cardinals
66
Packers
58
49ers
55
Jets
30
Bills
29
Dolphins
28
Chiefs
27
Vikings
27
Cowboys
26
Falcons
25
Bengals
24
Raiders
24
Dodgers
23
Yanks
23
Patriots
20
Saints
19
Chargers
17
Seahawks
16
Steagles
16
Broncos
15
Buccaneers
15
Oilers
15
Card-Pitt
11
Panthers
8
Texans
5
Titans
5
Jaguars
4
Ravens
4
Bulldogs
2
Dallas Texans
1
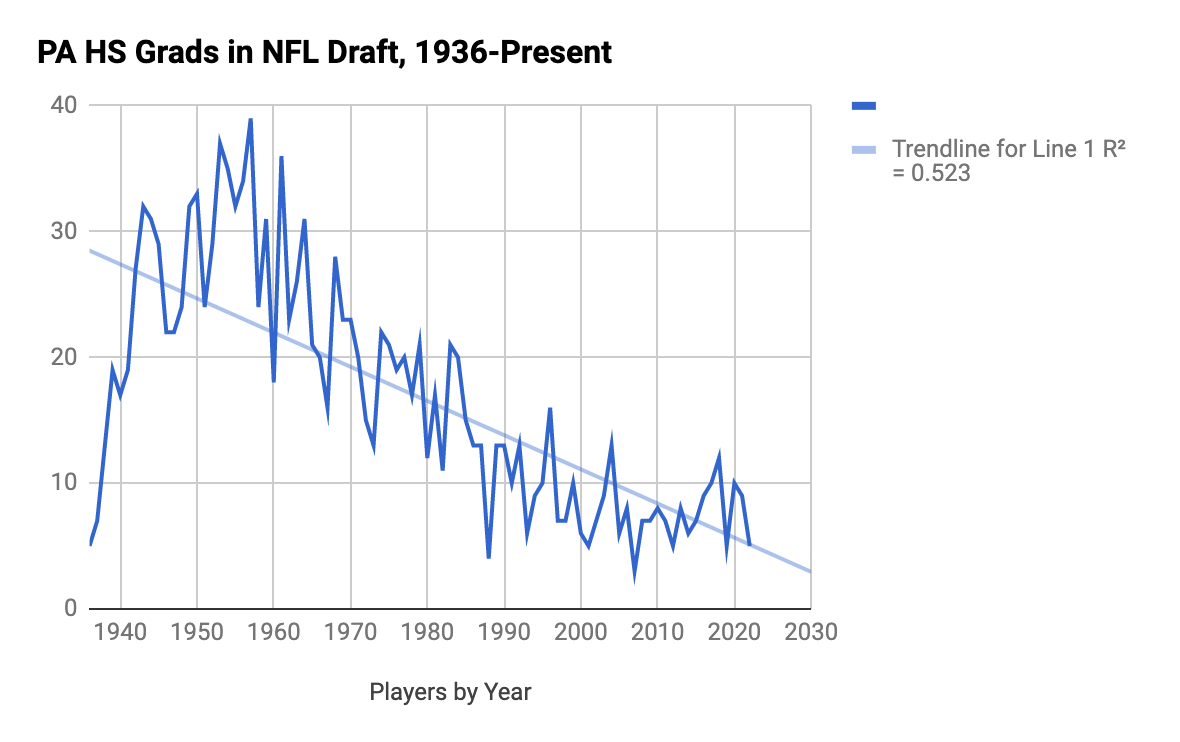
The number of drafted Pennsylvania players has dropped greatly over time. There are many reasons for this, but two stand out to me: fewer players are drafted today and the concentration of football talent has largely shifted south and west over the past 50 years or so. In 1976, there were 487 total selections in the NFL Draft. Today, that number fluctuates between about 253 and 260 depending on compensatory picks, so the total volume of selections is much lower today.
The peak years for Pennsylvanians in the NFL Draft came from the mid-1940s through the late-1960s. From 1942 through 1971, there were only two NFL Drafts where fewer than 20 Pennsylvanians were selected. In twelve of those drafts, more than thirty players from the state were selected, with an all-time high of 39 in 1957. Compare that to more modern times, when only three drafts since 2005 have seen 10 Pennsylvanians chosen. The last time twenty players from the state were drafted in one year was 1984.
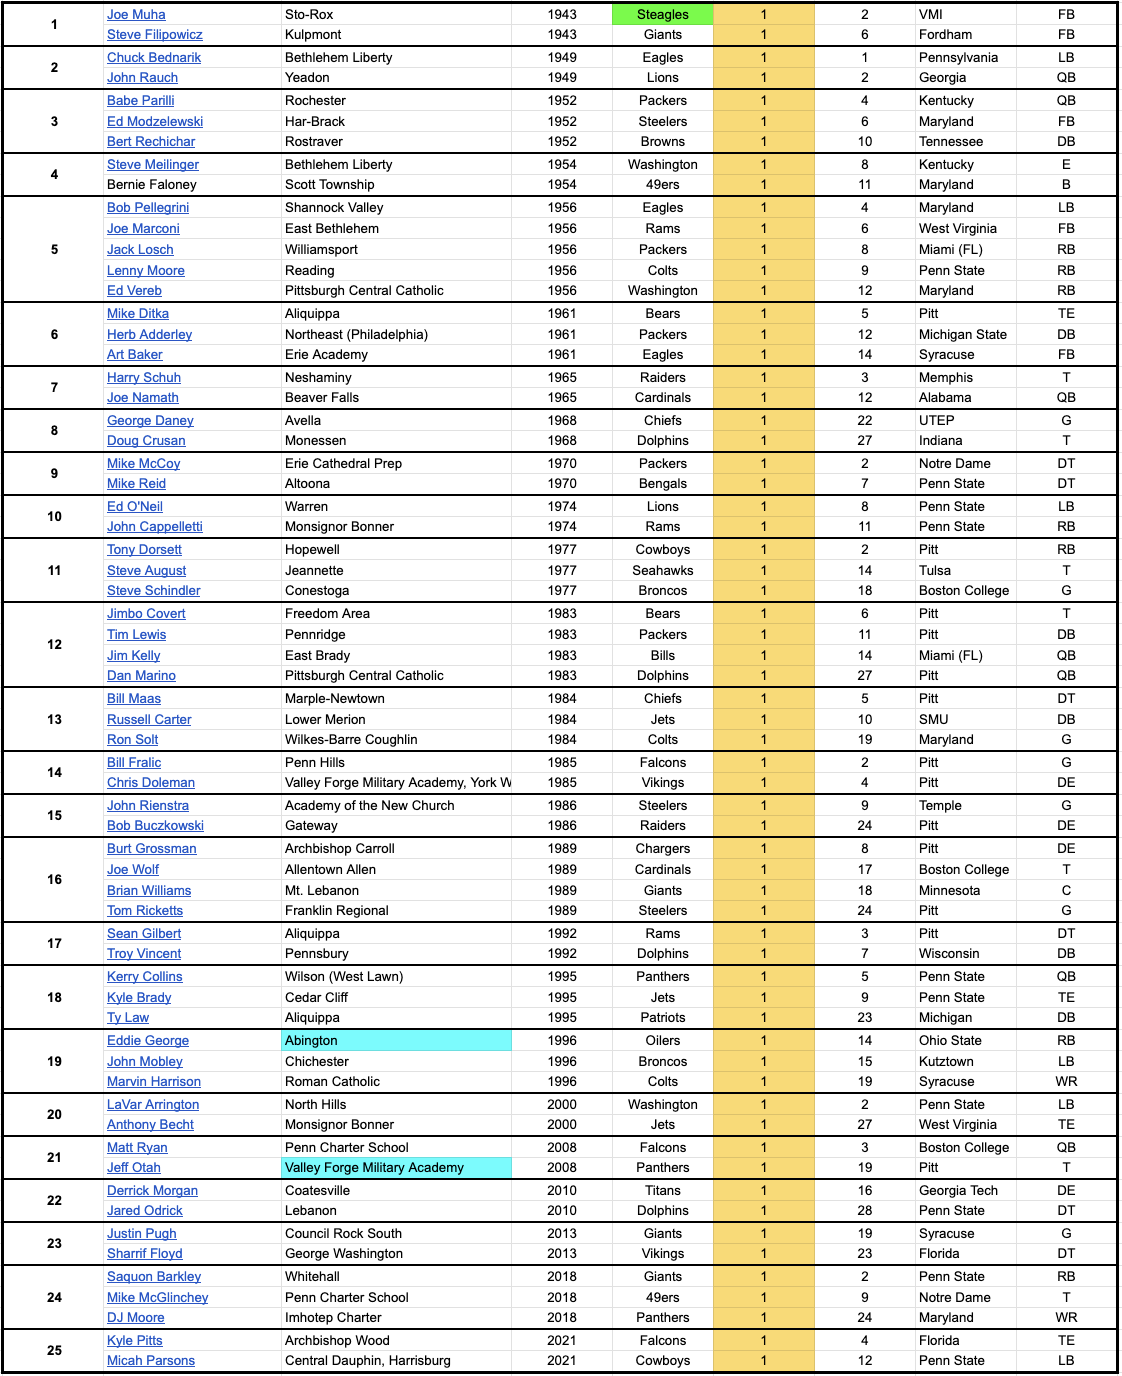
When it comes to first round picks, Pennsylvania high schools have produced 94 of them in the NFL Draft, from Boyd Brumbaugh of Steel Valley in 1938 to Jahan Dotson of Nazareth last year. A list of all Pennsylvanian first round picks can be found here.
The 1956 draft was the high-water mark for the state, with four alums going in the top 10 and five in the top 12. Bob Pellegrini (Shannock Valley) went 4th, Joe Marconi (East Bethlehem) went 6th, Jack Losch (Williamsport) went 8th, Lenny Moore (Reading) went 9th, and Ed Vereb (Pittsburgh Central Catholic) went 12th.
The following schools have had multiple first round selections:
HIGH SCHOOL
FIRST ROUND PICKS
Aliquippa
5
Altoona
2
Bethlehem Liberty
2
Monsignor Bonner
2
New Castle
2
Penn Charter School
2
Penn Hills
2
Pittsburgh Central Catholic
2
Roman Catholic
2
Sharon
2
That’s a decent amount of info to digest, so we’ll stop there. Please send any corrections or additions my way and, as always, thanks for reading.
A database of every All-State football selection, one of the biggest projects I’ve ever attempted on this site, has finally been completed. It was begun in 2015, put on the shelf for a long time, and finally completed following about seven months of work throughout 2022. The result: a listing of all 18,836 known All-State football players from the first Associated Press team in 1939 through last season’s selections.
Before getting to the results of this project, there are a few things that I should detail and explain. This was a massive project and it will be beneficial to understand the caveats that may exist in the data:
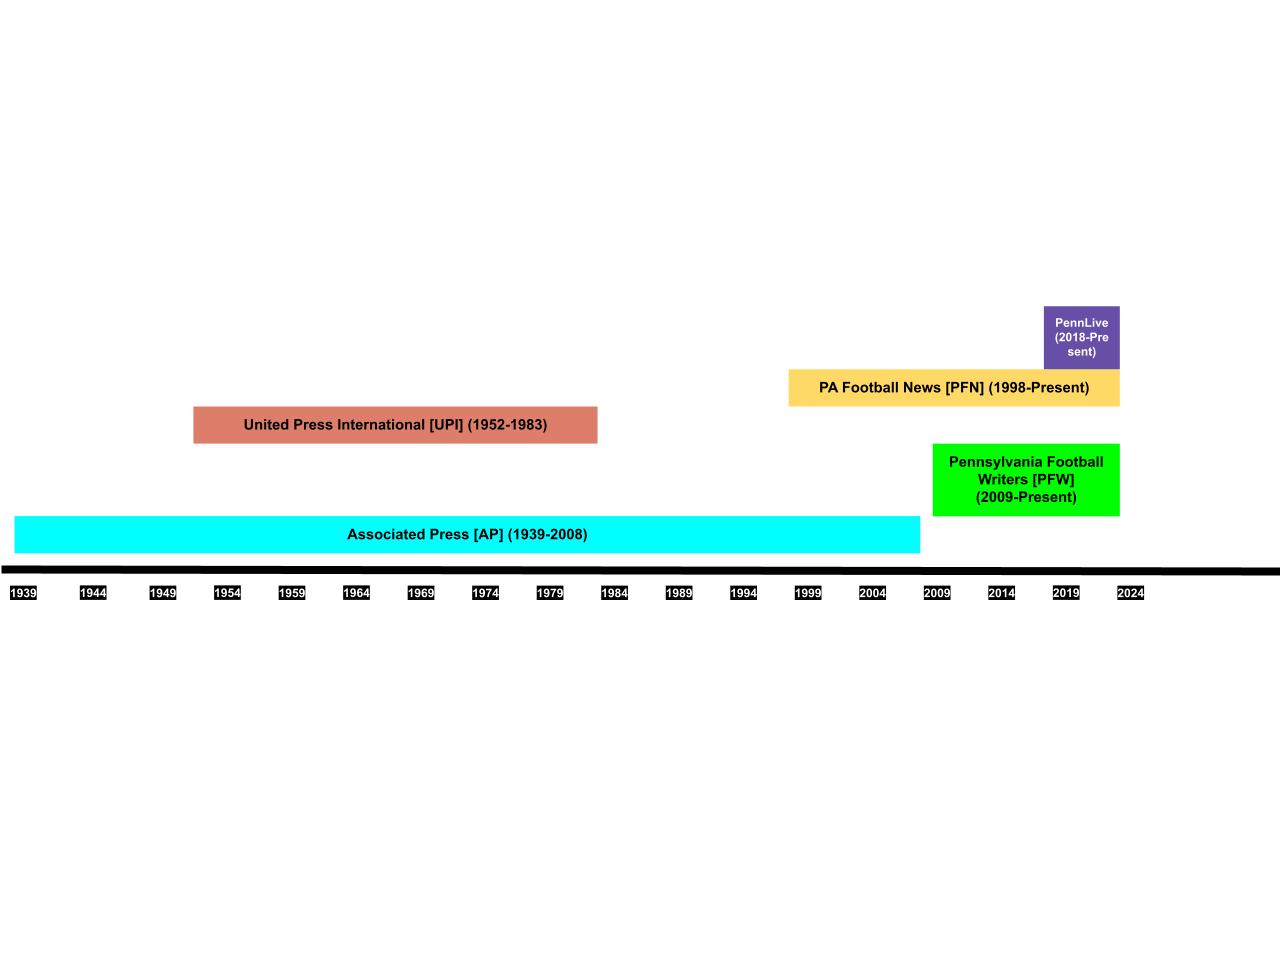
This data is based upon the All-State teams selected by five sources:
The Associated Press (1939-2008). This was the original All-State selection source and was the only selector in the state for various stretches of time.
The Pennsylvania Football Writers (2009-Present). In early incarnations it was called the Pennsylvania Sports Writers team. This organization of writers from across the state picked up the AP’s mantle when it decided to stop naming teams.
The United Press International (1952-1984). The UPI chose teams were chosen by UPI writers until 1979, when they were selected by college football recruiters. The 1983 and 1984 teams were termed “The UPI Pride of Pennsylvania” teams and selected the 25 best players in the state rather than a full roster of players.
Pennsylvania Football News (1998-Present). PFN chose between two and four teams per year based on classification until recently, when it has picked one team per classification with a larger number of slots (i.e., 3-4 quarterbacks make the team).
PennLive (2018-Present). In 2018, PennLive began picking one offensive and one defensive team representing the best players in the state regardless of class. While it is by far the newest team included in this project, PennLive (and the associated Harrisburg Patriot-News) are, in my mind, the paper of record when it comes to statewide high school football. Thus, I included these teams.
All data from 1939 through 2011 were found in the 2012 Pennsylvania Football News Resource Guide. Selections from 2012-Present were found via many hours of internet research.
All State team selectors over time
The data is as complete as humanly possible. I’ve checked and re-checked the raw data in this project multiple times, but the size of it still allows the chance for errors to exist. I know there are bound be typos and name misspellings, but I am fairly confident that these should be few and far between. There were at times errors and typos in the source material for this project, but I have done my best to correct those. If you see a missing name and can provide evidence for its inclusion, please let me know (pafbhistory@gmail.com or @pa_fb_history on Twitter).
All-State selections vs. All-State players. On the sheets that show total All-Staters for each school, remember that these count each individual selection, not distinct players. For example, if a player was selected to two different All-State teams in the same year, that counts as two selections for the school’s overall tally.
Schools are listed as they appeared in that year’s All-State list. I chose to list a player as representing the school he played for the year he was selected rather than use the school’s current name. This means that, for example, all selections for Downingtown are separated from those from Downingtown East and Downingtown West. The Saylor Record Spreadsheets often lump the “original” school’s statistics in with one of the new versions formed by a high school splitting into multiple buildings, but for consistency’s sake I decided to keep all of the school’s separated. If you’d like, you can simply find all of the past versions of your school’s program and lump their selections together to form an overall number – that’s up to you.
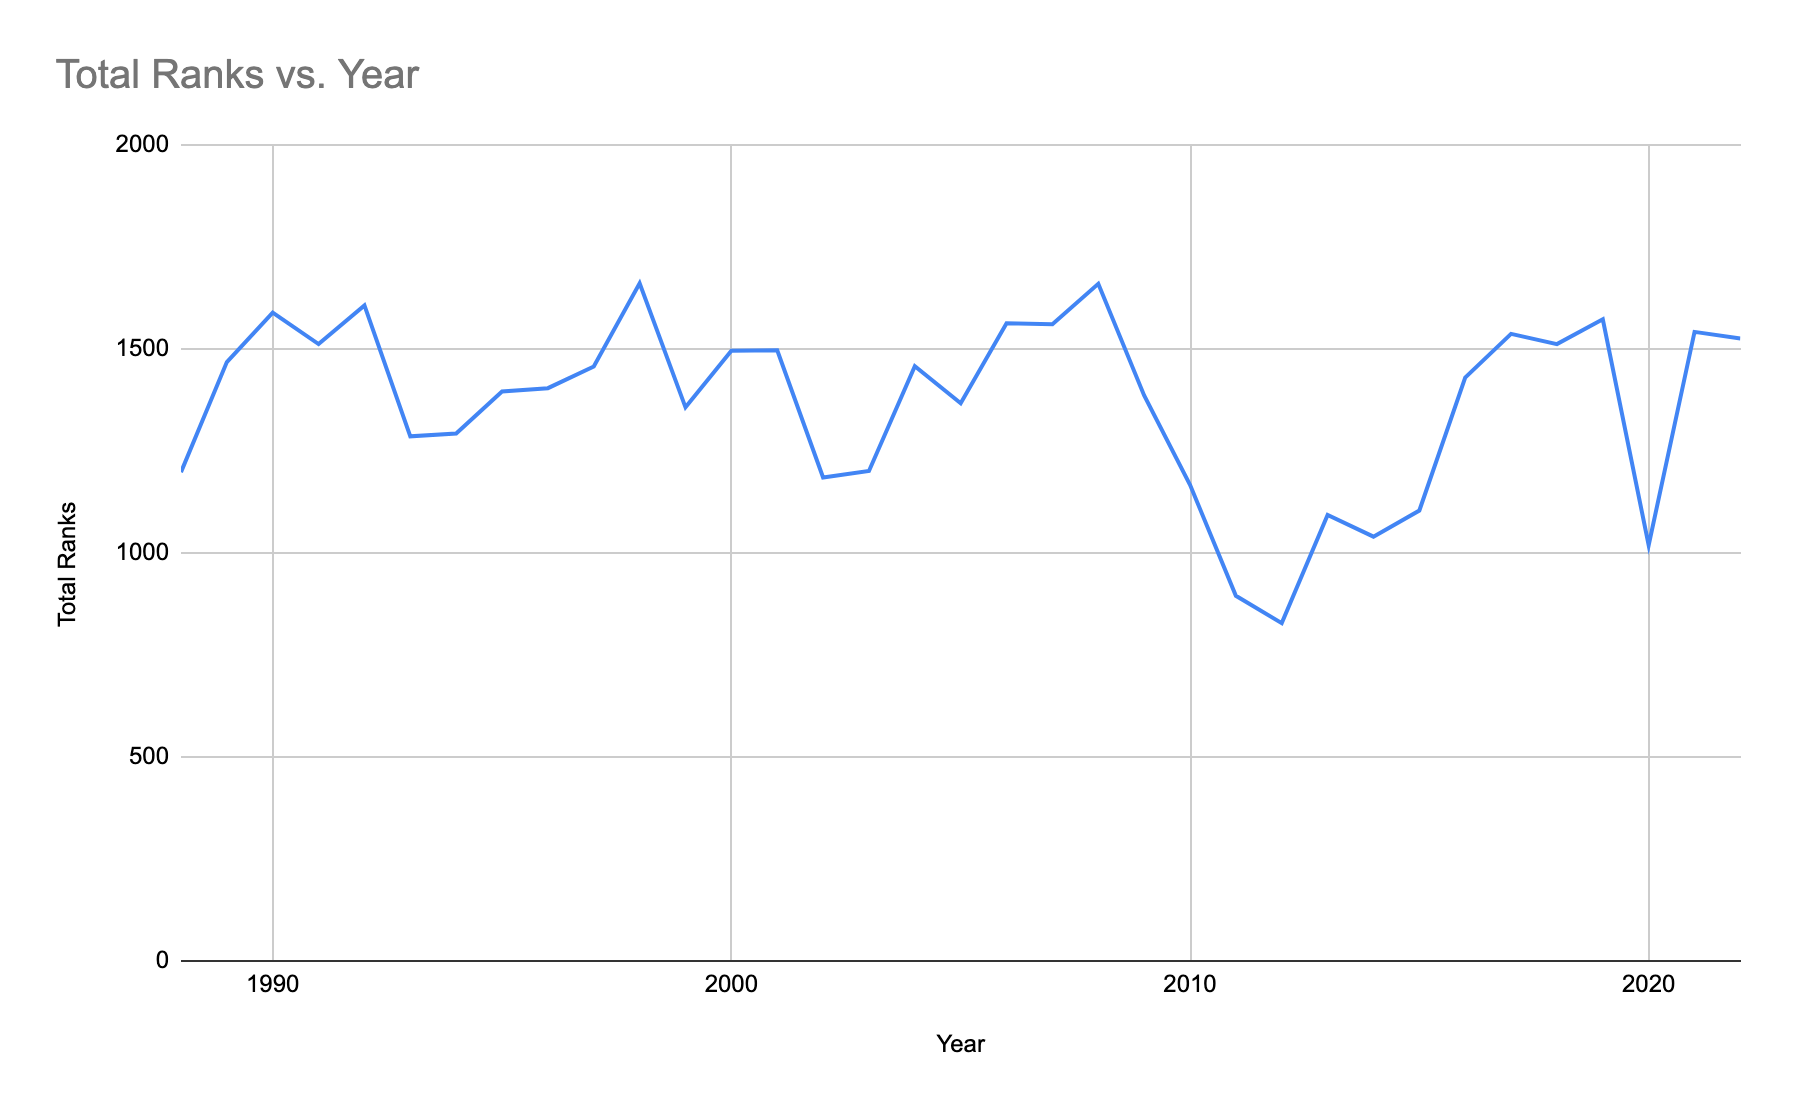
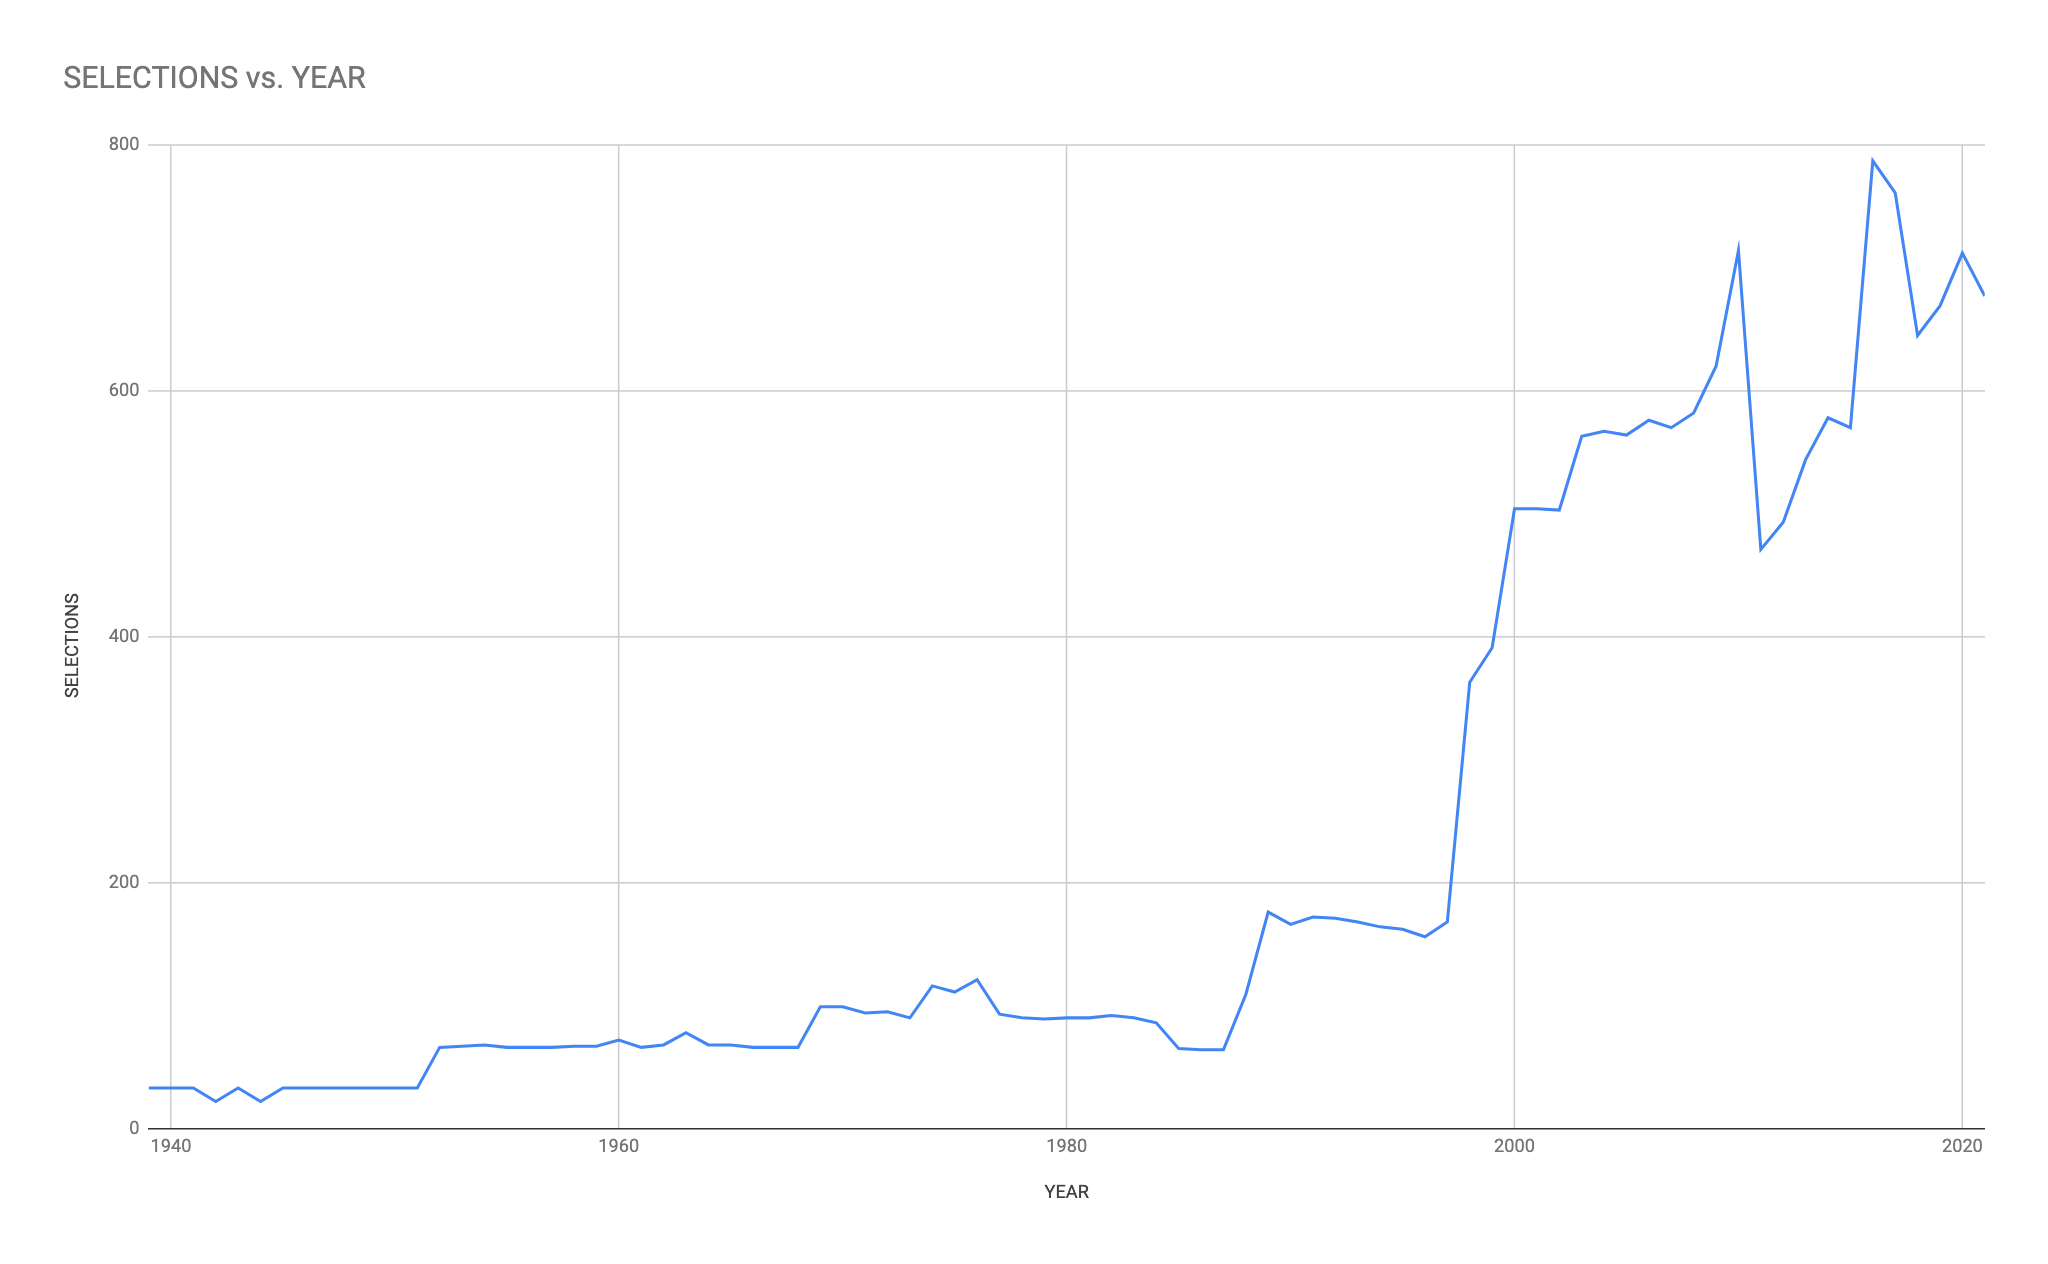
Selections are heavily skewed to more recent years. The graph below illustrates how dramatic the rise in overall selections has been over time. This is for a few reasons. First of all, there are currently more services that select All-State teams than there were in various periods of history. Second, those selectors tend to choose more teams (i.e., a 1st, 2nd, 3rd, and sometimes 4th team) than in early years of All-State teams. Third, selectors in the modern era often choose separate teams for each classification rather than use the original method of choosing one team for all of the programs in the state. Finally, there are more positions selected today than in the early era. For example, the AP (which began selecting teams in 1939) only chose offensive players until 1969. All of these factors combine to heavily favor more recent dynasties and strong programs than ones that existed prior to the mid-1970s. From 1939-1951, only 33 players were selected each year, with the exception of 1942 and 1944, when only 22 players were chosen. Today, an average of around 700 selections are made each year, with an all-time high of 787 in 2016.
In all, 711 different schools have had at least one All-State selection over the past 83 seasons. Check out all of the data below: