Pennsylvania high school football entered a new chapter in 1988 with the birth of the statewide playoff system. This created a path for teams to be crowned state champion (on the field, anyway) for the first time.
This new era led to the creation of the first subjective statewide polls, which the Harrisburg Patriot-News began that same year. In this database, all presently known state rankings have been documented. I’ll break up the rest of the important info in bullet points below, and then we’ll take a look at some trends, interesting facts, etc., at the end of this post.
What to Know About This Database
PLEASE look over this section before digging into the data, as many of your questions will be answered here:
There are missing weeks in this dataset. As of the end of the 2022 season, there are about 577 weeks where we’d expect rankings from the P-N. This dataset has 546 weeks completed as of the posting of this article, so 94.6% of the rankings are input and complete. Not bad! But I’m still searching for 30 hard-to-find rankings to complete the set. Those missing weeks can be found below; if you have any info that can help me fill in these blanks, please let me know.
Honorable Mention selections were not made in the preseason rankings fr 1989 and 2020. Additionally, no rankings were published for Week 1 in 2020.
To my knowledge, the Patriot-News rankings were the first subjective statewide rankings in Pennsylvania. Other mathematical systems (like the Saylor Ratings and Dunkel Index) had been published prior to 1988. The Patriot-News rankings were compiled by Rod Frisco from 1988 through about 2009. Since then, they’ve been selected by Eric Epler.
This database currently consists of 47,833 entries. Due to this size, there are bound to be small errors here and there, but a lot of time has been spent making sure this database is as accurate as possible. At times, there were errors in the rankings themselves, like a team being ranked 10th AND as an Honorable Mention or other copyediting mistakes, and those have been corrected in this database. In 1990 and 1998, Whitehall was ranked in one classification for part of the year, and then a correction was made in later weeks. The same thing happened to Bellwood-Antis in 2019, Cambridge Springs in 1989, and may have occurred other times that I haven’t caught yet. I’ve chosen to leave these rankings alone for the time being, but may correct them at a later time.
I made one edit to the state rankings, but I think I was justified to do so. In the 1997 Class A Final rankings, Riverside (Taylor) was No. 1 and Sharpsville was No. 2. However, Sharpsville had beaten Riverside, 10-7, in the state title game a few days before. I’m feel confident that this was a typo or a transcription error of some sort, but if someone can correct me, I’ll switch the rankings back.
Teams have been listed in the tables by the name the school had prior to any consolidation or split. So you’ll see a row for Downingtown, a row for Downingtown East, and one for Downingtown West, for example.
Teams were also listed with the district they were a member of in that year. For example, early years will show Mount Carmel in District 11, while more recent years will have them in District 4. The only exception to this involves the old District 12. Prior to the late 1990s (I believe), the PIAA designated teams in the far Northeastern part of the state as District 12 before folding them into District 2. To prevent confusion with the current District 12 (the Philadelphia Public & Catholic Leagues), I used District 2 for all of these schools throughout their ranking histories.
Some of the tables shown here have “Rank Points” and “Average Rank Points” columns. This was just an informal way to tally the quality of each team’s ranking at a raw and average level. Points were assigned similar to a track meet or the college football AP poll (10 points for 1st, 9 points for 2nd, etc.). A higher average means a team is ranked highly more often than a team with a lower average.
A Few Notable Things About the Data…
Let’s get to the fun part. You can find links to the data at the bottom of the post, but let’s dig in and look at a couple interesting things here:
The first-ever top-ranked teams? In 1988, the preseason Number 1 teams were North Hills (4A), Aliquippa (3A), Sto-Rox (2A) and Dunmore (1A). Names that have had relevance over the years, to say the least.
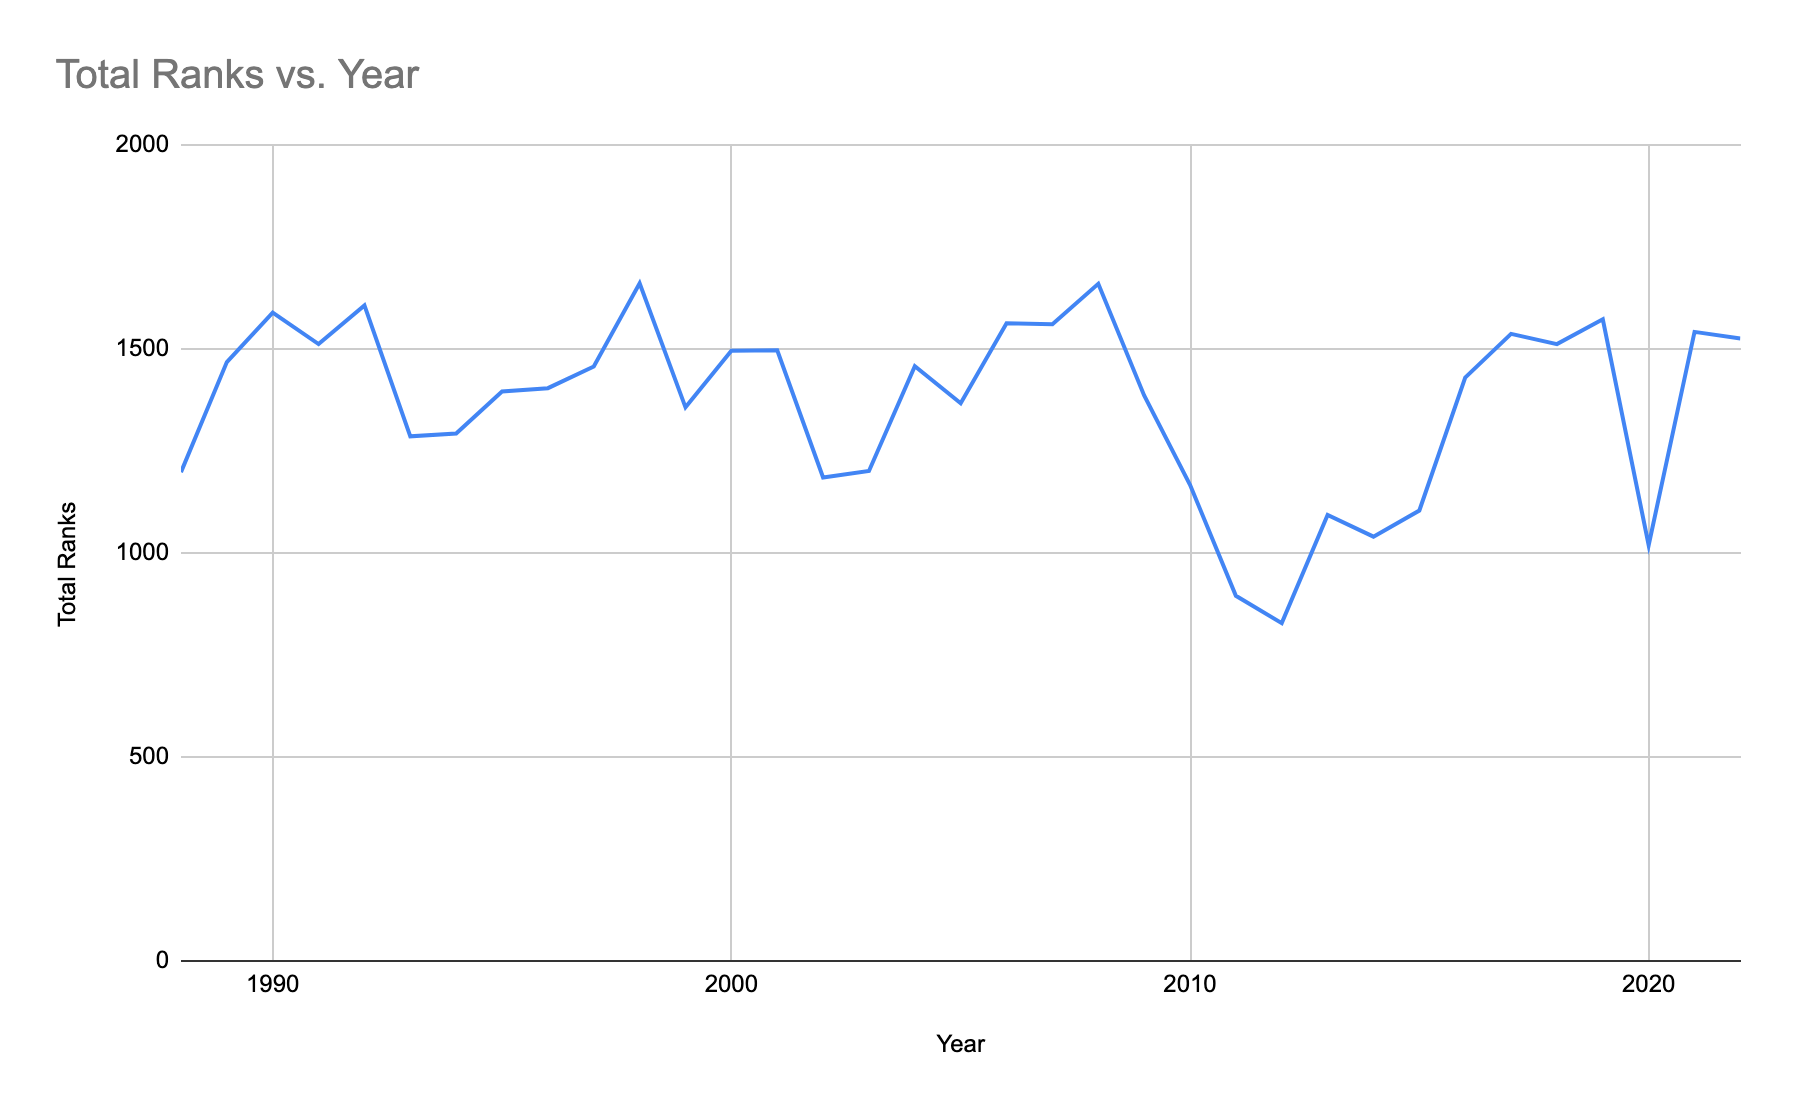
The number of Honorable Mention teams in each class has remained fairly stable over Epler’s tenure, especially since the advent of six classes. Most weeks, each class has between five and seven HM teams. Frisco, particularly in the 1990s, named many more HM teams per class. Some weeks featured as many as 24 HM teams in one classification. However, I don’t think this has dramatically impacted the overall data. Below is a chart showing how many total teams were ranked each year. It’s been fairly level over time when you take into account that some dips are due to years missing several weeks (and COVID shortening the 2020 season, of course).
Total teams to be ranked No. 1 all-time? 112. I don’t know about you, but this number was quite a bit higher than I had expected.
Southern Columbia has been ranked for 535 weeks, 200 of which at No. 1. Both are most in the state. This means the Tigers have been ranked for 98% of known weeks since 1988. They’ve been No. 1 for nearly 37% of those weeks.
Here are the 15 schools with the most weeks at No. 1:
TEAM
WEEKS AT NO. 1
Southern Columbia
200
Aliquippa
144
Berwick
126
Clairton
113
St. Joseph’s Prep
112
Thomas Jefferson
94
Archbishop Wood
82
Central Bucks West
73
Farrell
67
Pittsburgh Central Catholic
64
Mount Carmel
61
Cathedral Prep
58
Upper St. Clair
50
Strath Haven
49
Imhotep Charter
42
Weeks at No. 1 by PIAA District:
DISTRICT
WEEKS RANKED NO. 1
1
185
2
237
3
171
4
310
5
0
6
26
7
916
8
14
9
2
10
154
11
129
12 (since 2008)
262
Percentage of all ranked teams to come from each district:
DISTRICT
PERCENTAGE OF ALL RANKED TEAMS
1
9.8%
2
7.2%
3
15.7%
4
6.5%
5
1.7%
6
8.6%
7
25.5%
8
0.8%
9
3.7%
10
8.1%
11
9.7%
12
2.6%
Of the 95% of weeks found so far, 51.6% of ranked teams come from the Eastern part of the state (Districts 1, 2, 3, 4, 11 & 12), while 48.4% come from the West.
Teams with the most weeks ranked at each spot:
RANK SPOT
TEAM
WEEKS AT THAT SPOT
1
Southern Columbia
200
2
Manheim Central
86
3
Aliquippa & Rochester
64
4
Southern Columbia
73
5
Manheim Central
44
6
Wilmington
41
7
Manheim Central
37
8
Bellwood-Antis
44
9
Berwick & Bellwood-Antis
33
10
Clearfield
28
HM
Wilson (West Lawn)
173
One more table, just for fun. Here are the schools with the most all-time weeks in the rankings without rising above a certain spot. In other words, Wilson has been ranked for more weeks than any other school that has not reached No. 1. As always, remember that this data is only based on the 95% of found rankings and may change as additional weeks are input:
Thanks, Mike – I really appreciate it. This information was primarily gathered from my newspaper.com searches; the several missing weeks will need to be researched in a library in the coming months. This is the only website this information would be listed on as far as I’m aware. You can email me at pafbhistory@gmail.com and we can discuss things further, if you’d like. I appreciate you reading!


Awesome job; very impressive. I’ll write about this at some point; who should I credit? Is this information located on a website? Thanks
>
LikeLike
Thanks, Mike – I really appreciate it. This information was primarily gathered from my newspaper.com searches; the several missing weeks will need to be researched in a library in the coming months. This is the only website this information would be listed on as far as I’m aware. You can email me at pafbhistory@gmail.com and we can discuss things further, if you’d like. I appreciate you reading!
LikeLike